My Swing Trading Approach
I added a couple of positions yesterday, as conditions improved, booked profits in Netflix (NFLX) for a small +1% profit early on. I will play it cautious here, especially considering the larger than usual gap down the market is facing.
Indicators
- Volatility Index (VIX) – Popped another 5%, but still sporting the long upper shadows on the chart. Inverse head and shoulders pattern near a confirmation point.
- T2108 (% of stocks trading above their 40-day moving average): Lost 6% yesterday as it dropped down to 51%. Not a lot of strength in this indicator, and shows that stocks under the surface are struggling.
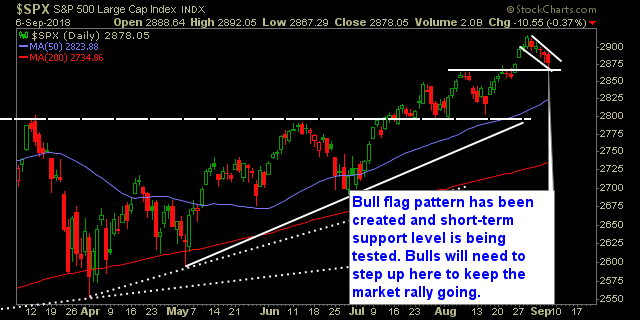
- Moving averages (SPX): SPX tested and held the 20-day moving average, but looks to test that area once again today.
- RELATED: Patterns to Profits: Training Course
Sectors to Watch Today
Utilities continue to soar higher, back in breakout mode. Telecom finally with a respectable day, bouncing off of its 50-day moving average, yet again. Industrials remains one of the bright sports for the market this week. Financials still appears to be unpredictable and uncommitted to a direction. Healthcare still working that bull flag pattern. Technology testing the rising trend-line off of the June lows. 
My Market Sentiment
The bulls have a great looking flag pattern to work with here, and is currently testing support in the short-term at 2864. Needs to hold, or a move down to the 50-day MA becomes more likely, and possibly the 2801 price level again.
S&P 500 Technical Analysis
Current Stock Trading Portfolio Balance
- 3 Long Positions

