My Swing Trading Approach
I closed out my long position in SPXU (3:1 SPX short ETF) on Tuesday afternoon for a 6.3% profit. Sure, it’d be nice to still have it today, with the market gapping much lower, but after a 90 point sell-off on Tuesday, and a day-off in between, I had no desire to risk those profits on a potential gap higher the following day that wipes out half my profits. Nonetheless, I’m 100% cash here today and I’m totally fine with that. I’m not overly interested in shorting this market at the open when SPX has already dropped over 130 points in two trading sessions combined, but will consider a long position, if we can see the market flush lower, and put in an emotional bottom.
Indicators
- Volatility Index (VIX) – VIX popped a whopping 26% on Tuesday while holding the 50-day moving average. Still no ‘higher-high’ in place, but would need to move over 23.81 in order to do so which is the area it is flirting with at today’s open.
- T2108 (% of stocks trading above their 40-day moving average): A 36% drop yesterday is very concerning as it takes the indicator back down to 31%. It would be a grave concern for the bulls if it loses 22 level going forward.
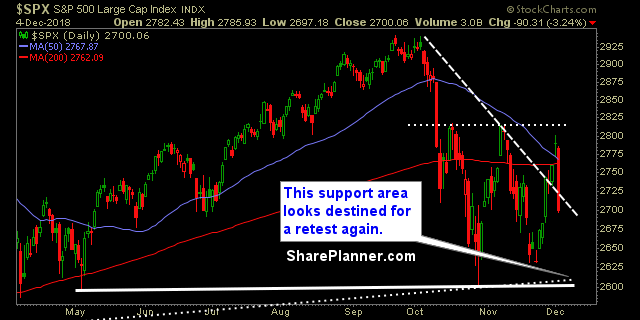
- Moving averages (SPX): Just a day after breaking through the 50 and 200-day MA’s, to the upside, Tuesday saw it lose both, along with the 5, 10 and 20-day moving averages and now trades below all the major moving averages. Certainly not an everyday occurrence.
- RELATED: Patterns to Profits: Training Course
Sectors to Watch Today
Utilities are back to being the favorite of the market as risk-off is the name of the game. Technology did much better in relation to the other sectors, which isn’t what you’d expect in a broad-based sell-off. I doubt that lasts, should the selling continue. Energy looks ready to test its lows again. This sector never really bounced. Financials showing signs of a total meltdown and Industrials looks like it may be ready to break below the November lows. 
My Market Sentiment
The November lows look to get tested here. An extremely choppy area for the market going back to October 11th. Far from being oversold, this market has a lot of room to the downside here, and could get downright ugly if October lows do not ultimately hold.
S&P 500 Technical Analysis
Current Stock Trading Portfolio Balance
- 100% cash.

