My Swing Trading Approach
Stopped out of one position but added another on Friday. Holding respectable gains in two of my positions, but likely to stay put as the market remains on uncertain footing at recent highs. The market continues to have issues over the past week with fading morning gains, throughout the afternoon. I need to see that stop before adding any additional long positions.
Indicators
- Volatility Index (VIX) – Broke the 200-day moving average for the first time since early October ’18 with a -2.6% move and closed at 16.14.
- T2108 (% of stocks trading above their 40-day moving average): Amazing that this indicator continues to climb as much as it has. Sitting with an 84% reading is extreme, and likely part of the reason the market has a hard time holding on to afternoon profits.
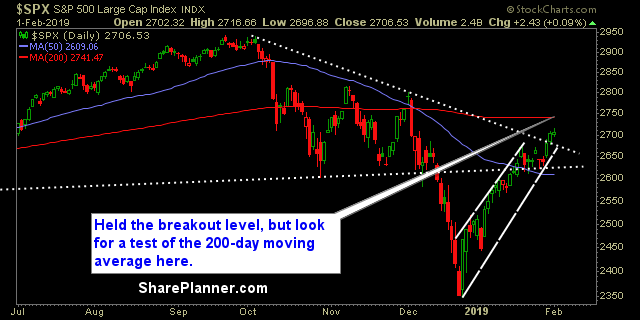
- Moving averages (SPX): The 200-day moving average is right in the cross-hairs of this market. I expect that MA to pose a significant struggle for the S&P 500.
- RELATED: Patterns to Profits: Training Course
Sectors to Watch Today
Energy continues to build upon its bull flag breakout mode. with little resistance to the upside. Financials struggling to push through the 200-day moving average, while Technology followed through on its own break through of the 200-day MA. Discretionary lagged the market, primarily due Amazon’s (AMZN) earnings report. 
My Market Sentiment
I am not overly crazy about how overbought the current market is. Yet it continues to push higher. That doesn’t mean it can’t be traded, but it does mean that there should be some caution, and one should limit how much capital is exposed at these levels.
S&P 500 Technical Analysis
Current Stock Trading Portfolio Balance
- 30% Long.

