My Swing Trading Strategy
If this market has you tired and annoyed over the past week, you are not alone. The low volume, whimsical trading patterns, certainly makes for some unpredictable markets providing poor breadth and lack of consistency on a day-to-day basis. With four positions open, plan to stay put today, unless we get a massive rally out of nowhere.
Indicators
- Volatility Index (VIX) – A respectable pop of 8.4% yesterday taking the indicator back up to 14.28. Over the past couple of months there have been multiple moves to the 17-18 range, following a move like yesterday’s. Let’s see if that unfolds in the days that follow.
- T2108 (% of stocks trading above their 40-day moving average): Hard sell-off that reignites the bearish divergence story line, as SPX hovers at the rally highs, stocks have been losing momentum under the surface. Current reading following yesterday’s 12% decline sits at 58%.
- Moving averages (SPX): Broke below the 5-day moving average for the first time in nine trading sessions. Could see a test of the 10-day or 20-day moving averages.
- RELATED: Patterns to Profits: Training Course
Sectors to Watch Today
Utilities, to me, looks like it is sporting a bull flag here, but could just as easily create a topping pattern should it drop another 1%. Staples still has a lot of momentum in its corner, while Technology did a great job of not being too impacted by yesterday’s sell-off. Energy lost a chunk of the gains from the previous three trading sessions while Healthcare and Real Estate showing more weakness than the rest of the sectors the last two days.

My Market Sentiment
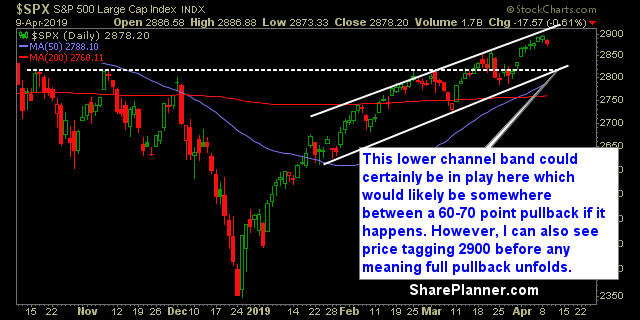
The lower channel band in the chart below could be in play over the next few days or weeks, and would result in a pretty solid pullback if that were to occur. However, there hasn’t been enough volume of late to really drive prices down further. The price movement intraday remains erratic at best.
S&P 500 Technical Analysis
Current Stock Trading Portfolio Balance
- 40% Long.

Welcome to Swing Trading the Stock Market Podcast!
I want you to become a better trader, and you know what? You absolutely can!
Commit these three rules to memory and to your trading:
#1: Manage the RISK ALWAYS!
#2: Keep the Losses Small
#3: Do #1 & #2 and the profits will take care of themselves.
That’s right, successful swing-trading is about managing the risk, and with Swing Trading the Stock Market podcast, I encourage you to email me (ryan@shareplanner.com) your questions, and there’s a good chance I’ll make a future podcast out of your stock market related question.
In this podcast episode, Ryan talks about how he uses profit multiples for taking profits on his swing-trades, and how not everyone of your trades that are winners will be 2:1 or 3:1 multiples of the amount that you risked on the trade.
Be sure to check out my Swing-Trading offering through SharePlanner that goes hand-in-hand with my podcast, offering all of the research, charts and technical analysis on the stock market and individual stocks, not to mention my personal watch-lists, reviews and regular updates on the most popular stocks, including the all-important big tech stocks. Check it out now at: https://www.shareplanner.com/premium-plans
📈 START SWING-TRADING WITH ME! 📈
Click here to subscribe: https://shareplanner.com/tradingblock
— — — — — — — — —
💻 STOCK MARKET TRAINING COURSES 💻
Click here for all of my training courses: https://www.shareplanner.com/trading-academy
– The A-Z of the Self-Made Trader –https://www.shareplanner.com/the-a-z-of-the-self-made-trader
– The Winning Watch-List — https://www.shareplanner.com/winning-watchlist
– Patterns to Profits — https://www.shareplanner.com/patterns-to-profits
– Get 1-on-1 Coaching — https://www.shareplanner.com/coaching
— — — — — — — — —
❤️ SUBSCRIBE TO MY YOUTUBE CHANNEL 📺
Click here to subscribe: https://www.youtube.com/shareplanner?sub_confirmation=1
🎧 LISTEN TO MY PODCAST 🎵
Click here to listen to my podcast: https://open.spotify.com/show/5Nn7MhTB9HJSyQ0C6bMKXI
— — — — — — — — —
💰 FREE RESOURCES 💰
My Website: https://shareplanner.com
— — — — — — — — —
🛠 TOOLS OF THE TRADE 🛠
Software I use (TC2000): https://bit.ly/2HBdnBm
— — — — — — — — —
📱 FOLLOW SHAREPLANNER ON SOCIAL MEDIA 📱
X: https://x.com/shareplanner
INSTAGRAM: https://instagram.com/shareplanner
FACEBOOK: https://facebook.com/shareplanner
STOCKTWITS: https://stocktwits.com/shareplanner
TikTok: https://tiktok.com/@shareplanner
*Disclaimer: Ryan Mallory is not a financial adviser and this podcast is for entertainment purposes only. Consult your financial adviser before making any decisions.


