My Swing Trading Strategy
I closed out two trades yesterday that essentially cancelled each other out (small loss/small profit). I added one new position to the portfolio. However, I am hesitant to add a new long position in the face of what we saw yesterday with the large wave of afternoon selling. If it that follows through into today, I will consider adding a short position to play the move.
Indicators
- Volatility Index (VIX) – A massive pop on the $VIX yesterday of 12.8%, taking the indicator well beyond the 50-day moving average. This is a key day here, because often those large moves are often sold off in the days that follow.
- T2108 (% of stocks trading above their 40-day moving average): An 8% break lower, but still within the recent range. I thought we might have seen a bigger washout in this indicator, but more of the same non-commitment.
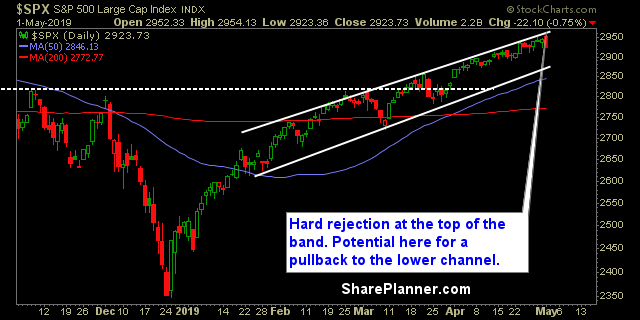
- Moving averages (SPX): SPX broke the 5-day and 10-day moving averages and could see a test of the 20-day today.
- RELATED: Patterns to Profits: Training Course
Sectors to Watch Today
Energy continues to get clobbered and the Material sector as well. The former is actually showing signs of a potential breakdown here, dropping six straight days already. I wouldn’t be surprised to see a bounce in the near-term, but ultimately it acts like it wants to head much lower. Technology still in a consolidation at its all-time highs, and Healthcare’s recent gains looks like nothing more than a dead cat bounce.

My Market Sentiment
FOMC Statement back to sabotaging market gains, with a massive sell-off yesterday. The last time there was that much selling was back on 3/22/19 when SPX dropped 54 points. Thereafter, the market bought the dip and rallied even higher. Very possible that is the case here, but wait and see as to whether this market intends to bounce or not.
S&P 500 Technical Analysis
Current Stock Trading Portfolio Balance
- 30% Long.

