My Swing Trading Strategy
I sold Netflix (NFLX) for a +1.5% profit yesterday. I didn’t add any new positions today, and am willing to get short should the market show a willingness to sell off further this morning.
Indicators
- Volatility Index (VIX) – Sold off for the seventh time in the last ten trading sessions. Surprising to see it trade lower despite market weakness. Currently at 14.75, which is notably lower, but likely to bounce higher today.
- T2108 (% of stocks trading above their 40-day moving average): A 10% decline yesterday, now sets it up to break the May lows. That would be a decisively bearish move by the indicator and indicating much greater weakness than what the market is showing.
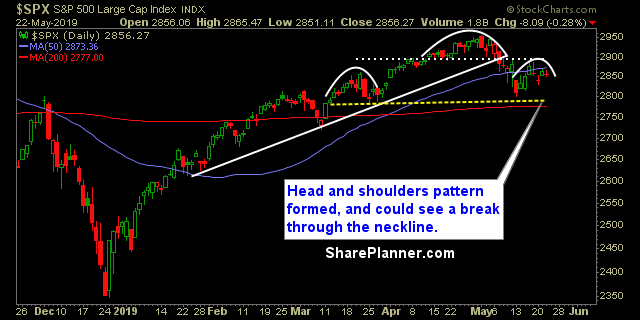
- Moving averages (SPX): Lost the 5-day moving average yesterday, and set up to lose the 10-day MA at the open as well.
- RELATED: Patterns to Profits: Training Course
Sectors to Watch Today
Utilities very close to breaking out to new all-time highs here. Staples coming out of its bull flag pattern here. Head and shoulders pattern very close to confirming on Technology. Bear Flag formed on Financials. Energy has the same pattern but confirmed it yesterday. 
My Market Sentiment
A major head and shoulders pattern quickly forming and very close to breaking the neckline, perhaps not today, but in the days ahead.
S&P 500 Technical Analysis
Current Stock Trading Portfolio Balance
- 20% Long

