My Swing Trading Strategy
This has been by far the most difficult month of trading that I have ever seen. I mean, when you have a Twitter account that can bring ruin to the financial markets, it makes predictability a lot more difficult. The month of May started with a tweet fanning the flames of the already Chinese and now is ending with a tweet starting a new trade war with Mexico.
Indicators
- Volatility Index (VIX) – Though it did manage to finish 3.4% lower yesterday, expect this indicator to shoot through the roof.
- T2108 (% of stocks trading above their 40-day moving average): Diverging indicator yesterday with negative breadth despite a positive market. Reading comes in at 25%.
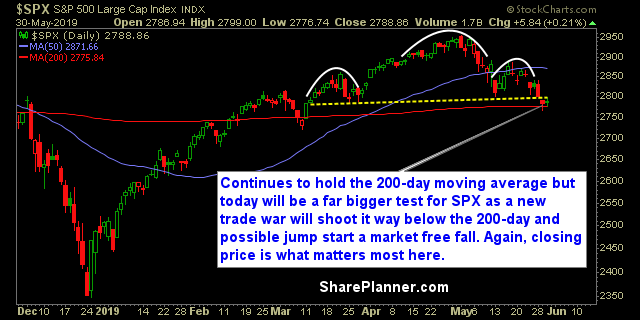
- Moving averages (SPX): The 200-day moving average will be broken at the market open.
- RELATED: Patterns to Profits: Training Course
Sectors to Watch Today
Technology was the market winner yesterday followed by Staples and Industrials. Energy continues its free fall and possibly even challenge the December lows again at some point. 
My Market Sentiment
SPX head and shoulders pattern confirmed yesterday and sets up for further downside once the 200-day MA breaks as well.
S&P 500 Technical Analysis
Current Stock Trading Portfolio Balance
- 40% Long

