My Swing Trading Strategy
One new position added yesterday, and considering another new position as well today. But the market needs to show that it can hold its gains into the close, something that has eluded it in each of the last six trading sessions.
Indicators
- Volatility Index (VIX) – Gave up its session gains, but still closed just above the 50-day moving average. Again, the 5/22 lows need to be taken out to support a bigger move higher for stocks as a whole.
- T2108 (% of stocks trading above their 40-day moving average): Flat day, but consolidating over the last three days. Has pressure overhead from the 50-day moving average.
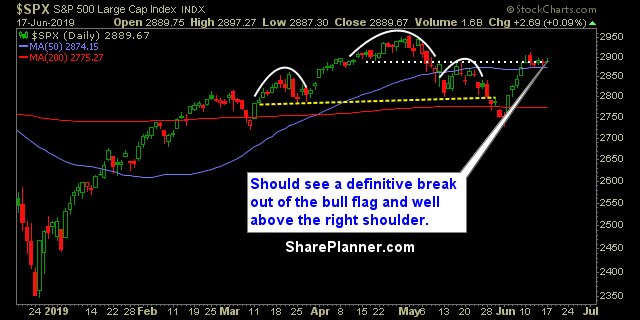
- Moving averages (SPX): SPX currently trading above all of its major moving averages, but sitting on the 5-day moving average and just above the 50-day MA.
- RELATED: Patterns to Profits: Training Course
Sectors to Watch Today
Healthcare breaking out of its five day consolidation, and yesterday’s market leader. Real Estate remains strong hitting new all-time highs, in a very aggressive way. Technology bull flagging well, and could see a breakout today. Financials still struggling to catch a break, while oil is trying to base with an attempt at two straight days of gains. 
My Market Sentiment
The sixth straight day of consolidation – the bull flag seen on the chart here is holding up really well. Any weakness during this time has been on extremely low volume. Tomorrow is FOMC day which could make things interesting as investors await to hear whether there will be rate cuts in July and September.
S&P 500 Technical Analysis
Current Stock Trading Portfolio Balance
- 50% Long

Welcome to Swing Trading the Stock Market Podcast!
I want you to become a better trader, and you know what? You absolutely can!
Commit these three rules to memory and to your trading:
#1: Manage the RISK ALWAYS!
#2: Keep the Losses Small
#3: Do #1 & #2 and the profits will take care of themselves.
That’s right, successful swing-trading is about managing the risk, and with Swing Trading the Stock Market podcast, I encourage you to email me (ryan@shareplanner.com) your questions, and there’s a good chance I’ll make a future podcast out of your stock market related question.
When it comes to investing in a bear market, done right, we should be hoping for there to be a bear market not attempting to avoid it altogether. And we can do that when we are getting the right entries on our previous investments, and the manner in which we managed the risk in them via profit taking. In this podcast episode, Ryan details his approach to long-term investing and why he welcomes, with open arms, a bear market for his long-term portfolio.
Be sure to check out my Swing-Trading offering through SharePlanner that goes hand-in-hand with my podcast, offering all of the research, charts and technical analysis on the stock market and individual stocks, not to mention my personal watch-lists, reviews and regular updates on the most popular stocks, including the all-important big tech stocks. Check it out now at: https://www.shareplanner.com/premium-plans
📈 START SWING-TRADING WITH ME! 📈
Click here to subscribe: https://shareplanner.com/tradingblock
— — — — — — — — —
💻 STOCK MARKET TRAINING COURSES 💻
Click here for all of my training courses: https://www.shareplanner.com/trading-academy
– The A-Z of the Self-Made Trader –https://www.shareplanner.com/the-a-z-of-the-self-made-trader
– The Winning Watch-List — https://www.shareplanner.com/winning-watchlist
– Patterns to Profits — https://www.shareplanner.com/patterns-to-profits
– Get 1-on-1 Coaching — https://www.shareplanner.com/coaching
— — — — — — — — —
❤️ SUBSCRIBE TO MY YOUTUBE CHANNEL 📺
Click here to subscribe: https://www.youtube.com/shareplanner?sub_confirmation=1
🎧 LISTEN TO MY PODCAST 🎵
Click here to listen to my podcast: https://open.spotify.com/show/5Nn7MhTB9HJSyQ0C6bMKXI
— — — — — — — — —
💰 FREE RESOURCES 💰
My Website: https://shareplanner.com
— — — — — — — — —
🛠 TOOLS OF THE TRADE 🛠
Software I use (TC2000): https://bit.ly/2HBdnBm
— — — — — — — — —
📱 FOLLOW SHAREPLANNER ON SOCIAL MEDIA 📱
X: https://x.com/shareplanner
INSTAGRAM: https://instagram.com/shareplanner
FACEBOOK: https://facebook.com/shareplanner
STOCKTWITS: https://stocktwits.com/shareplanner
TikTok: https://tiktok.com/@shareplanner
*Disclaimer: Ryan Mallory is not a financial adviser and this podcast is for entertainment purposes only. Consult your financial adviser before making any decisions.


