My Swing Trading Strategy
No new positions added on Friday, instead I rode my current positions all day long. Mainly because I wanted to see whether we were going to be engaged in a multi-day pullback or not. So far that looks to be the case with the weakness in the pre-market.
Indicators
- Volatility Index (VIX) – Wild doji formed on the VIX daily, as it remains in a downtrend, but managed to break the six-day sell-off in the index.
- T2108 (% of stocks trading above their 40-day moving average): Despite negative breadth out of the market and a market sell-off overall on SPX, the positive move by small caps on Friday were enough to help lift the indicator up 3.3% to 68% – the best such reading since early March.
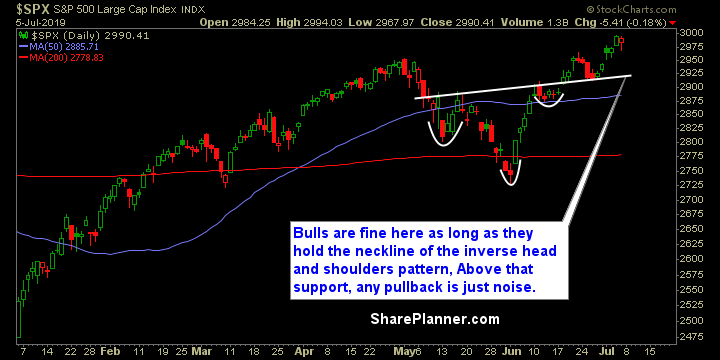
- Moving averages (SPX): Trading above all major moving averages. Tested and held the 5-day moving average.
- RELATED: Patterns to Profits: Training Course
Sectors to Watch Today
Financials led the way on Friday, as the sector is quickly making its way back up to its all time highs from January 2018. Materials showing much more weakness over the last four days following its dramatic June rally. The pullback was overdue and not a threat just yet to the trend’s integrity. Telecom continues its surge riding six straight days of strong gains, while Energy managed to rebound and possibly setting up for some upside here in the coming days. 
My Market Sentiment
The bounce off of the neckline of the inverse head and shoulders pattern has been very strong, and while the market sits at all-time highs with aggressive buying, a pullback or consolidation would be healthy for this market. Any pullback will be just fine as long as the neckline support holds up. Small caps are worth watching, as they showed relative strength on Friday.
S&P 500 Technical Analysis
Current Stock Trading Portfolio Balance
- 30% Long

Welcome to Swing Trading the Stock Market Podcast!
I want you to become a better trader, and you know what? You absolutely can!
Commit these three rules to memory and to your trading:
#1: Manage the RISK ALWAYS!
#2: Keep the Losses Small
#3: Do #1 & #2 and the profits will take care of themselves.
That’s right, successful swing-trading is about managing the risk, and with Swing Trading the Stock Market podcast, I encourage you to email me (ryan@shareplanner.com) your questions, and there’s a good chance I’ll make a future podcast out of your stock market related question.
When it comes to investing in a bear market, done right, we should be hoping for there to be a bear market not attempting to avoid it altogether. And we can do that when we are getting the right entries on our previous investments, and the manner in which we managed the risk in them via profit taking. In this podcast episode, Ryan details his approach to long-term investing and why he welcomes, with open arms, a bear market for his long-term portfolio.
Be sure to check out my Swing-Trading offering through SharePlanner that goes hand-in-hand with my podcast, offering all of the research, charts and technical analysis on the stock market and individual stocks, not to mention my personal watch-lists, reviews and regular updates on the most popular stocks, including the all-important big tech stocks. Check it out now at: https://www.shareplanner.com/premium-plans
📈 START SWING-TRADING WITH ME! 📈
Click here to subscribe: https://shareplanner.com/tradingblock
— — — — — — — — —
💻 STOCK MARKET TRAINING COURSES 💻
Click here for all of my training courses: https://www.shareplanner.com/trading-academy
– The A-Z of the Self-Made Trader –https://www.shareplanner.com/the-a-z-of-the-self-made-trader
– The Winning Watch-List — https://www.shareplanner.com/winning-watchlist
– Patterns to Profits — https://www.shareplanner.com/patterns-to-profits
– Get 1-on-1 Coaching — https://www.shareplanner.com/coaching
— — — — — — — — —
❤️ SUBSCRIBE TO MY YOUTUBE CHANNEL 📺
Click here to subscribe: https://www.youtube.com/shareplanner?sub_confirmation=1
🎧 LISTEN TO MY PODCAST 🎵
Click here to listen to my podcast: https://open.spotify.com/show/5Nn7MhTB9HJSyQ0C6bMKXI
— — — — — — — — —
💰 FREE RESOURCES 💰
My Website: https://shareplanner.com
— — — — — — — — —
🛠 TOOLS OF THE TRADE 🛠
Software I use (TC2000): https://bit.ly/2HBdnBm
— — — — — — — — —
📱 FOLLOW SHAREPLANNER ON SOCIAL MEDIA 📱
X: https://x.com/shareplanner
INSTAGRAM: https://instagram.com/shareplanner
FACEBOOK: https://facebook.com/shareplanner
STOCKTWITS: https://stocktwits.com/shareplanner
TikTok: https://tiktok.com/@shareplanner
*Disclaimer: Ryan Mallory is not a financial adviser and this podcast is for entertainment purposes only. Consult your financial adviser before making any decisions.


