My Swing Trading Strategy
With the ISM report that came out yesterday and instantly reversed the market in a very hard and quick manner, it has suddenly created a much more bearish market going forward. I tightened my stops today, and will continue to do so where necessary going forward.
Indicators
- Volatility Index (VIX) – A 14% pop yesterday broke the VIX through short-term declining resistance and sets up for a move that could take it up to 21 in the coming days.
- T2108 (% of stocks trading above their 40-day moving average): A very bearish move in the T2108 that broke key long-term support and dropped the indicator 20% down to 51% .
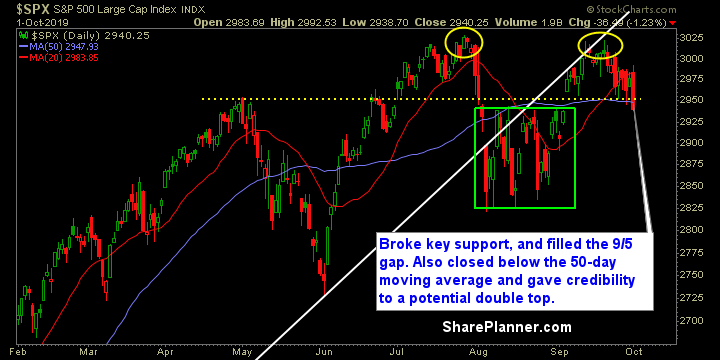
- Moving averages (SPX) Broke below the 5-day moving average, but more importantly pushed right through the 50-day moving average.
- RELATED: Patterns to Profits: Training Course
Sectors to Watch Today
Industrials experienced a huge reversal yesterday and instead of breaking out in the early going as they were showing, the ISM drove price below the 50-day moving average and sets up for another test of the 200-day MA in the coming days. All of the sectors traded lower yesterday, but it was the defensive sectors that fared the best, with Utilities and Staples showing the best relative strength. Surprisingly, Technology did far better than expected, and was not leading the way lower. 
My Market Sentiment
Double top pattern forming on SPX, breaking 50-day moving average, and key support level. Filled gap from 9/5 and futures gapping lower this morning. To say the least, the market, in the blink of an eye, went from a potential bounce scenario to an instantly bearish outlook.

Current Stock Trading Portfolio Balance
- 2 Long Positions.
