Pre-market update:
- Asian markets traded 0.4% lower.
- European markets traded 0.9% lower.
- US futures are trading 0.3% lower.
Economic reports due out (all times are eastern): Durable Goods Orders (8:30), Jobless Claims (8:30), EIA Natural Gas Report (10:30), Kansas City Fed Manufacturing Index (11),
Technical Outlook (SPX):
- Cup and handle pattern formed overnight and heading into the market open on the 5-minute chart of S&P futures.
- Yesterday was by far the most selling in exactly one month in the markets.
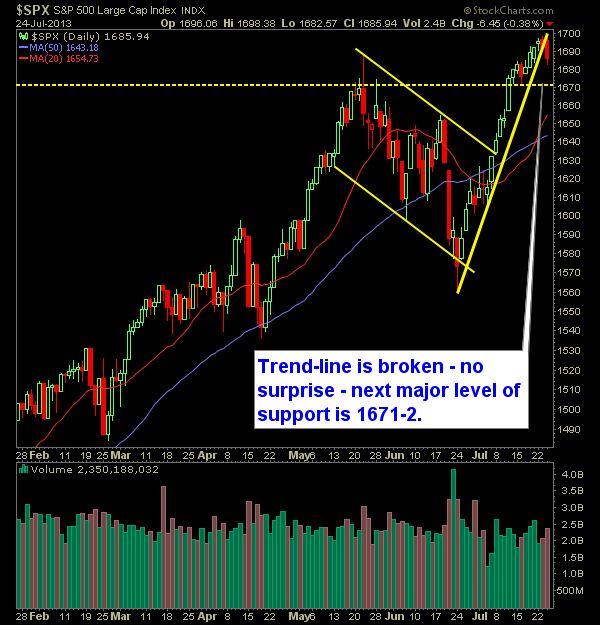
- SPX broke the rising trend-line off of the 6/24 lows yesterday. This isn’t a major concern as I didn’t suspect that the steepness of such a trend-line could hold for much longer.
- Worth noting is that the 10-day moving average held its own and should be closely watched today.
- If we see any significant amount of selling today, you will want to watch the 1671-2 level as a significant short-term support level. Break below it, and you likely have a much heavier sell-off at hand.
- I think it is safe to say that 1700 is a real source of resistance for this market at this po int.
- Pay no attention right now that the market is over-extended. Such conditions rarely matters with the Fed’s involvement in the markets.
- VIX is back into the 13′s.
- This uptrend looks nearly the same as the one we saw on 4/19 and lasted until 5/19. I’m curious if it will lead to a similar extended pullback as a result.
- Markets don’t care about the economy. That is not what is driving them. The markets only care about what the Fed is doing to keep equities propped up.
My Opinions & Trades:
- Closed CL at 58.47 for a 0.6% loss. They report earnings today.
- Added RCI at 40.65
- Current Longs: SOHU at 67.91, WU at 17.45, MENT at 20.55, HRB at 30.19, SJM at 104.63, BDX at 99.98, GOOG at 887.47
- May look to take gains in stocks that are stagnant and replace them with better setups today.
- Join me each day for all my real-time trades and alerts in the SharePlanner Splash Zone
Chart for SPX:

