Technical Outlook:
- If you thought Monday was a boring trading session, yesterday just about had it beat.
- Volume was a bit higher, but way below recent averages.

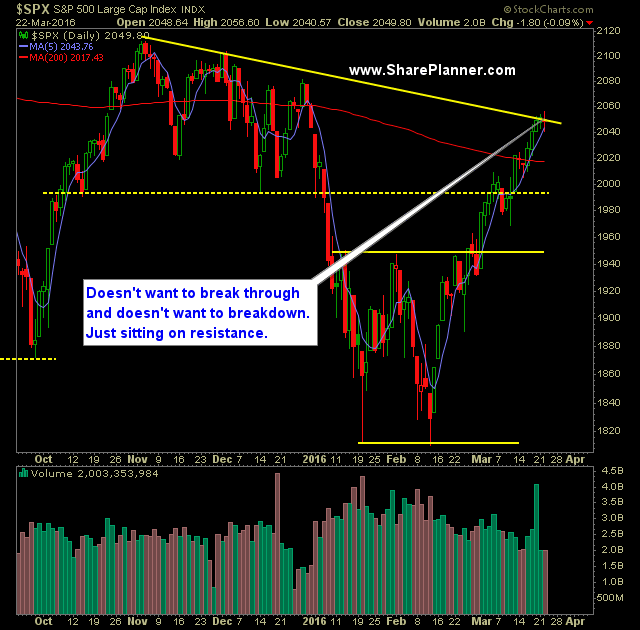
- SPX is essential coiling here at recent highs in a manner similar to a bull flag pattern.
- Dow Jones Industrial, has hit long-term declining resistance off of the May 2015 highs. Unable to push through at this point.
- SPX struggling to break through the downtrend off of the November highs. Testing it for a third straight day and failing.
- 30 minute chart of SPX over the past three trading sessions has gone flat with signs pointing towards distribution.
- Tons and tons of year long resistance between 2040 and all-time highs (really!).
- VIX broke its 5 day losing streak by popping a modest 2.8%.
- T2108 (% of stocks trading above their 40-day moving average) remains flat and stable of late. Not giving up much ground but not gaining any either.
- If you are bearish at this point, the key isn’t to be extremely bearish, but to be bearish for a modest pullback. A digestion of recent gains. Don’t get greedy with the profits that could be made.
- 5-Day Moving average on SPX is unbelievably strong. As is the 10-day MA.
- The theme in the market of late is not how much it is going up each day but how much it manages to recover off of the lows of the day.
- SPX rallied for a 5th straight week, and in excess of 1% each time – not seen since the bottom of March 2009 was hit.
- The biggest issue surrounding this market at this time is that reward with long setups is just on par with risk, if not worse.
My Trades:
- Did not add any new swing-trades yesterday.
- Did not close out any swing-trades yesterday.
- Currently 10% Short / 90% Cash
- Careful to add long exposure considering that the market is as overbought as has been in years. A pullback, not necessarily a major one is in order here.
- Join me each day for all my real-time trades and alerts in the SharePlanner Splash Zone

