Technical Outlook:
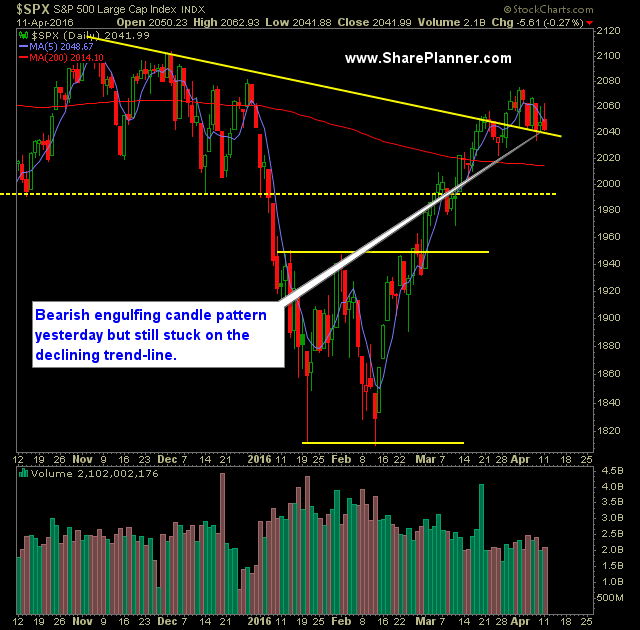
- Strong open yesterday that was erased gradually as the day wore on resulting in a lower close.
- SPX dropped below the 20-day moving average again.
- Declining trend-line off of last July’s highs remains a continuous level of support for the market.
- Possibility that the price action over the last two weeks has formed a bull flag.
- 30 minute chart looks highly distributive and lends itself to the idea that it is trying to rollover.
- Volume dropped off on SPY for a second straight day and was well below average.
- The 5-day moving average is close a downward cross of the 20-day moving average, which hasn’t been seen since mid-February.
- VIX looking close to breaking out of its current base.
- Two key price levels to watch today – 1) The Friday lows from last week. 2) The lows from March 24th. Particularly, if the latter should break, it would put in a lower-low into the downtrend.
- Between 2040 and the all-time highs the price action is very congested with plenty of resistance.
- April has been bullish in nine of the last ten years.
- Yellen’s dovish outlook as it pertains to rate hikes has been, in large part, the reason for the massive rally off of the February lows.
My Trades:
- Did not place any trades yesterday.
- Did not close out any swing-trades yesterday.
- Currently 10% Long / 20% Short / 70% Cash
- Remain long TLT at $129.52, SPXU at $29.07 (an ETF short play).
- Will look to add short or long exposure here today depending on the direction the market decides to take.
- Join me each day for all my real-time trades and alerts in the SharePlanner Splash Zone

