Technical Outlook:
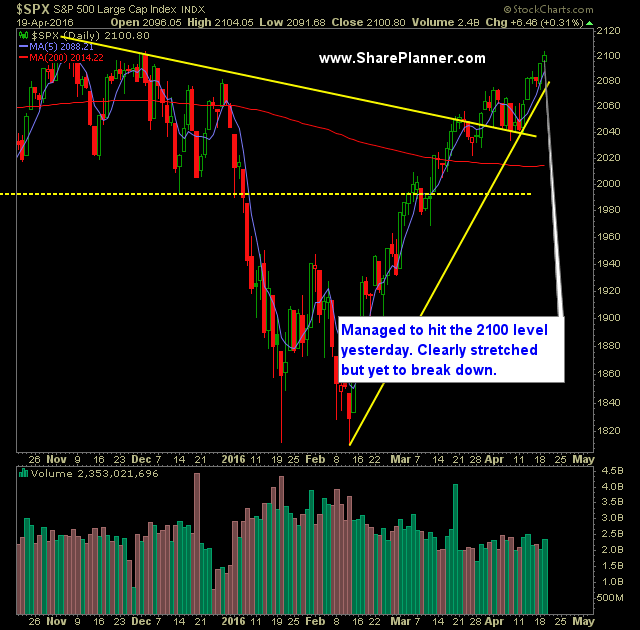
- Doji candle pattern yesterday, with today creating the potential for an evening star pattern should the market sell-off.

- With that said, there has been an impeccable resilience to price action of late, where every gap down or sign of weakness is immediately bought up by market participants.
- VIX is at a key support level that it has been unable to break through going back to July 2015. This is a level where previous sell-offs have started at and could be the same here again.
- Price action starting to look overextended and choppy on SPY 30 minute chart.
- Volume increased on SPY for a third consecutive day – not surprisingly, it is still below recent averages.
- SPX up five out of the last six trading sessions. And the one day it was down, it was hardy down.
- Nasdaq lagged the market yesterday, due primarily to weakness in FANG stocks and IBM.
- USO still looking at a possible double top on the charts in the short-term.
- Considering that in February the S&P 500 was down over 12% on the year, and two months later is looking at possibly making a run at new all-time highs is quite unfathomable and not something that should ever be deemed common place for the market.
- The market has been strong on the weekly chart rallying 7 out of the last 9 weeks and now looking to make it 8 out of the last 10.
- April has been bullish in nine of the last ten years.
- Yellen’s dovish outlook as it pertains to rate hikes has been, in large part, the reason for the massive rally off of the February lows.
My Trades:
- Added one new short position yesterday.
- Did not close out any swing-trades yesterday.
- Currently 10% Long / 20% Short / 70% Cash
- Remain long TLT at $129.52, SPXU at $27.51.
- Will cut the short positions and add new long exposure if the bears can not put together a move to the downside.
- Join me each day for all my real-time trades and alerts in the SharePlanner Splash Zone

