Technical Outlook:
- Dead cat bounce started yesterday resulting in one of the year’s best rallies.

- These bounces, if it remains part of a larger sell-off, can last anywhere between 2-4 days.
- The VIX is melting away at an incredible rate. Over the last two days, has gone from almost tagging 27, down to 18.75. Yesterday saw a decline of 21.4%. A push back below 20 historically has been where stock prices are deemed more stable.
- The T2108 (% of stocks trading above their 40-day moving average) rebounded nicely with a 29% move of its own all the way back up to 35.2.
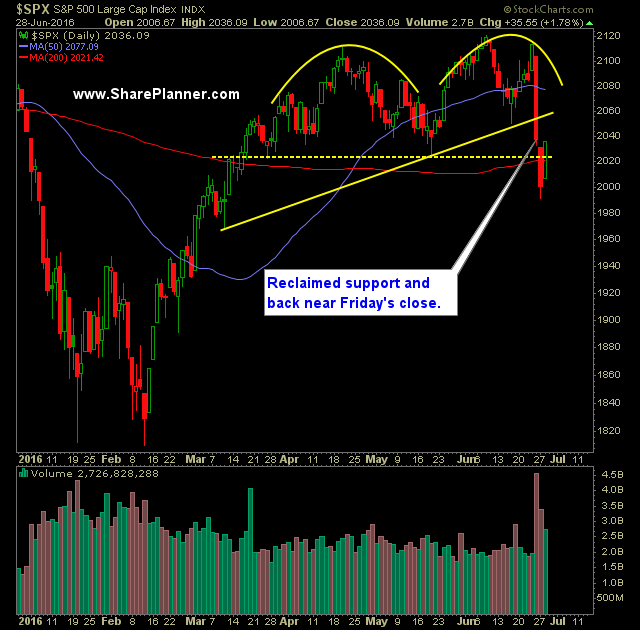
- The 200-day moving average was reclaimed in SPX and Dow yesterday. Still trades significantly below it on the Nasdaq and was rejected at the 200-day MA on the Russell.
- SPY managed to fill the gap on Monday’s decline. The larger gap left unfilled, of course, is the Friday’s gap following the Brexit vote.
- SPX managed to break back above the double top confirmation level.
- Russell 2000 had a solid bounce off of the 1090 level.
- As price creeps back into the 2050-2090 range on SPX, you have to be concerned with price action giving way again to bearish tendencies.
- Market is assuming that rate hikes are pretty much off the table for all of 2016.
- Volume was well above average yesterday, but still dropped for a second consecutive day.
- Biggest issue for the time being for the bears is that the Brexit vote to leave, may not generate a ton of additional headlines and there is no guarantee, that the politicians, who are against such a move, would even allow it to happen.
My Trades:
- Added three new long positions to the portfolio yesterday.
- Did not close out any positions yesterday.
- 30% Long / 70% Cash
- Cognizant of the fact that the market may run hard into resistance today and ultimately reversing.
- Bounces like the one tha started yesterday, typically lasts 2-3 days.
- Join me each day for all my real-time trades and alerts in the SharePlanner Splash Zone
Chart for SPX:

Welcome to Swing Trading the Stock Market Podcast!
I want you to become a better trader, and you know what? You absolutely can!
Commit these three rules to memory and to your trading:
#1: Manage the RISK ALWAYS!
#2: Keep the Losses Small
#3: Do #1 & #2 and the profits will take care of themselves.
That’s right, successful swing-trading is about managing the risk, and with Swing Trading the Stock Market podcast, I encourage you to email me (ryan@shareplanner.com) your questions, and there’s a good chance I’ll make a future podcast out of your stock market related question.
Ryan gives his best secrets and tips to shorting stocks and what he focuses on, what he trades, and how he trades them, as well as the must-knows about shorting stocks that no one else will tell you.
Be sure to check out my Swing-Trading offering through SharePlanner that goes hand-in-hand with my podcast, offering all of the research, charts and technical analysis on the stock market and individual stocks, not to mention my personal watch-lists, reviews and regular updates on the most popular stocks, including the all-important big tech stocks. Check it out now at: https://www.shareplanner.com/premium-plans
📈 START SWING-TRADING WITH ME! 📈
Click here to subscribe: https://shareplanner.com/tradingblock
— — — — — — — — —
💻 STOCK MARKET TRAINING COURSES 💻
Click here for all of my training courses: https://www.shareplanner.com/trading-academy
– The A-Z of the Self-Made Trader –https://www.shareplanner.com/the-a-z-of-the-self-made-trader
– The Winning Watch-List — https://www.shareplanner.com/winning-watchlist
– Patterns to Profits — https://www.shareplanner.com/patterns-to-profits
– Get 1-on-1 Coaching — https://www.shareplanner.com/coaching
— — — — — — — — —
❤️ SUBSCRIBE TO MY YOUTUBE CHANNEL 📺
Click here to subscribe: https://www.youtube.com/shareplanner?sub_confirmation=1
🎧 LISTEN TO MY PODCAST 🎵
Click here to listen to my podcast: https://open.spotify.com/show/5Nn7MhTB9HJSyQ0C6bMKXI
— — — — — — — — —
💰 FREE RESOURCES 💰
— — — — — — — — —
🛠 TOOLS OF THE TRADE 🛠
Software I use (TC2000): https://bit.ly/2HBdnBm
— — — — — — — — —
📱 FOLLOW SHAREPLANNER ON SOCIAL MEDIA 📱
*Disclaimer: Ryan Mallory is not a financial adviser and this podcast is for entertainment purposes only. Consult your financial adviser before making any decisions.


