Pre-market update:
- Asian markets traded 0.1% lower.
- European markets are trading 1.3% lower.
- US futures are trading 0.4% lower ahead of the market open.
Economic reports due out (all times are eastern): ICSC-Goldman Store Sales (7:45), Redbook (8:55)
Technical Outlook (SPX):
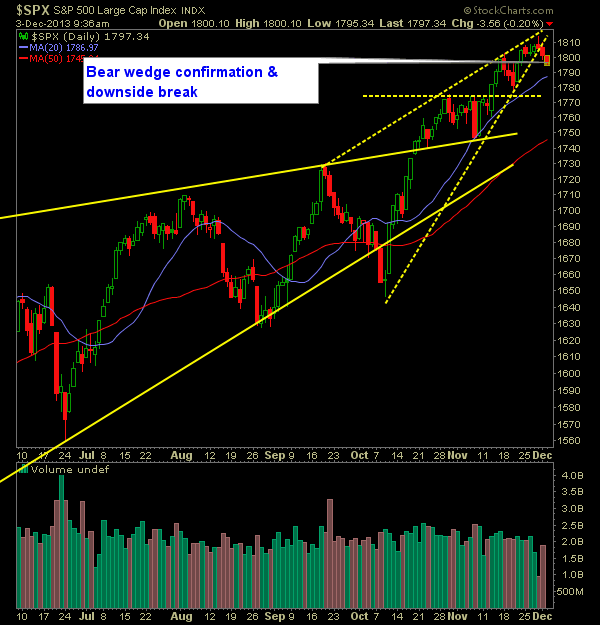
- Bearish wedge formation confirmed yesterday on the SPX chart. Being that we are up an unprecedented 8 straight weeks, this could be the pattern that signals the market’s first weekly pullback.
- We found support at the 10-day moving average, and will be key today to see whether the dip-buyers want to hold up this market.
- There is some room for this market to fall without causing much technical damage, but will want to avoid pushing below the 1777 level.
- The 20-day moving average which is currently at 1786 market a strong rally spot for the bulls the last two times it was tested.
- Volume picked back up yesterday.
- SPX 30-minute chart confirming a nasty head and shoulders pattern.
- VIX has been up 5 straight days. A strong bearish divergence in this market.
- SPX has risen for 8 straight weeks – since March’s 2009 bottom, that is unprecedented.
- A move below 1800 could get traders rather uneasy. The key level for the bulls to hold sits at 1777. At that point the current rally would be over and a new lower-low would be in place.
- In essence, I don’t see any reason to be heavily short yet in this market. Wait for the market to change directions first.
- Markets don’t care about the economy nor earnings. That is not what is driving them. The markets only care about what the Fed is doing to keep equities propped up.
My Opinions & Trades:
- Closed AAPL yesterday at $554.95 for a 5.9% gain.
- Closed GT yesterday at $22.26 for a 2.5% gain.
- Added one additional long position yesterday.
- Cut my exposure yesterday to reduce my long-side risk.
- Will look to tighten up the stop-losses on current trades.
- May add 1-2 new positions today.
- Current Longs: ETFC at 17.63, KKR at 23.18, JAH at 56.50.
- Long 40% / Cash 60%
- Join me each day for all my real-time trades and alerts in the SharePlanner Splash Zone
Chart for SPX:

