Technical Outlook:
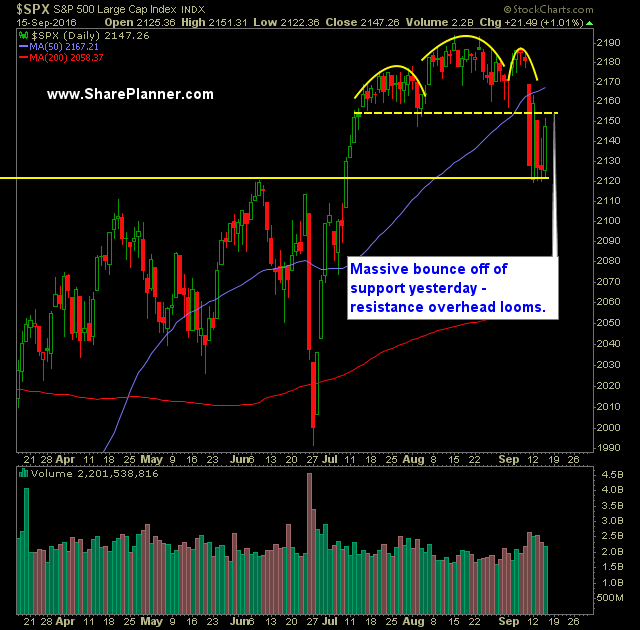
- Huge bounce on S&P 500 (SPX) yesterday that put in a strong case for a short-term bottom being formed at 2120.
- The rally yesterday took price back above the 5-day moving average which is something the index has been unable to do over the past week.
- SPY volume increased yesterday from the day prior and remains well above recent averages.
- The price action around the 2120 level and yesterday’s bounce that we saw, reminds me a lot of the bounces we saw at the 2040 level back in April and May, and all throughout 2015.
- Because of the rally in Apple (AAPL), the Nasdaq (QQQ) finds itself in a very favorable situation. It has bounced substantially off of the 50-day moving averages and on through the 5, 10 and 20-day MA’s as well. This is by far the strongest of all the indices right now and allowing the market to stave off another sell-off attempt.
- The market is choppy, you have to go with the ebbs and flows of it – I don’t recommend being heavily long or short at this moment.
- CBOE Market Volatility Index (VIX) took a beating yesterday dropping 10% down to 16.30. But nothing like what we saw on Monday’s rally in equities.
- This market could still easily reverse back down again, though I think the bears have lost a great deal of momentum here with yesterday’s move.
- If SPX continues to move higher today, it will find some heavy short-term resistance in the 2160-75 area that it will have to deal with.
- Crude (/CL) looks to break the September lows and likely move on toward the August lows.
My Trades:
- Sold XYL yesterday at $50.33 for a 2.3% profit.
- Covered T yesterday at $40.22 for a 1% profit.
- Sold SPXU yesterday at $24.13 (flat trade)
- Covered GOOGL at $802.05 for a 1.5% loss.
- Added 3 new swing trades to the portfolio yesterday.
- Remain short: TGT at $70.30
- May add 1-2 new swing-trades to the portfolio today.
- Currently 30% Long / 10% Short / 60% Cash
- Join me each day for all my real-time trades and alerts in the SharePlanner Splash Zone

