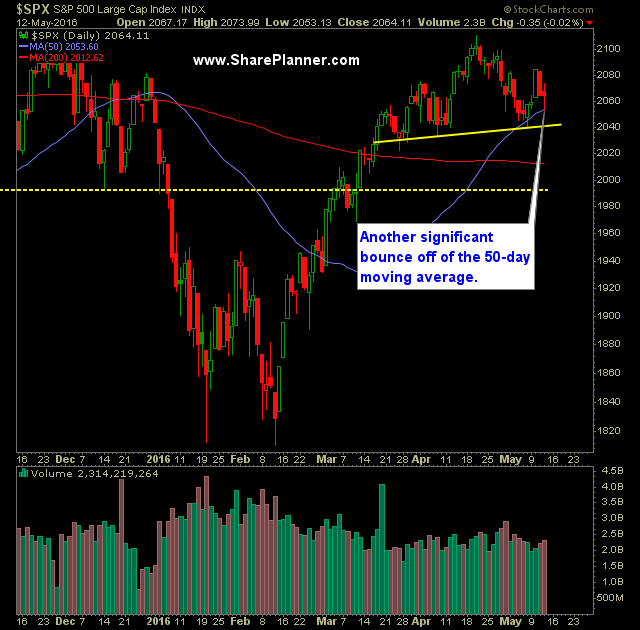
Technical Outlook:
- SPX gave up all of its morning gains and dropped further into the red throughout the morning. But, you guessed it, the bulls rallied the market hard in the afternoon to close the market at break even.

- For the purposes of staging entries into new positions in either direction, it becomes fairly difficult with the wild swings intraday in both direction.
- Head and shoulders pattern on the daily, is in play today. Watch support at 2039 for confirmation.
- Most notably is the strength that continues to occur at the 50-day moving average, which saw an immediate bounce yesterday once tested.
- Volume increased for a third straight day and right at recent averages.
- VIX dropped 2% yesterday and is at the 14.41.
- Yesterday was a difficult what the market was really trying to do. SPX finished the day flat, and all indicators were telling a different story.
- SPX traded back below the 10-day moving average for the first time this week.
- A close below 1257 would mark the first time since mid-January that SPX finished lower three straight weeks. And considering the price action, one of the weakest 3-week pullbacks I’ve ever seen.
- A break below 2039 would establish a new lower-low on the SPX 30 minute chart.
- Bulls need to push price back above yesterday’s highs to re-invigorate buyers (2074).
- From 2040 to 2138 – you have a price range that is insanely choppy and continues to be such. As a result, profits have to be taken quickly and often.
- The 50-week and 100-week moving average have crossed last week to the downside. Last time this happened was 2001 before the tech correction and again in June 2008 before the mortgage crisis saw its major correction.
- I believe at this point, profits have to be taken aggressively, and avoid the tendency to let the profits run – the market is in a very choppy range that has mired stock price for the past two years. Unless it breaks out of it and onto new all-time highs, then taking profits aggressively is absolutely important.
- Historically the May through October time frame is much weaker than the rest of the year.
My Trades:
- Sold SPXU yesterday at $28.19 for a 1.4% profit.
- Sold JNJ yesterday at $113.96 for a 1.2% profit.
- Added one new short position to the portfolio yesterday.
- Currently 10% Short / 90% Cash
- Will look to add to my shorts if the market can continue breaking down.
- Join me each day for all my real-time trades and alerts in the SharePlanner Splash Zone

