Pre-market update (updated 7:30am eastern):
- European markets are trading -0.4% lower.
- Asian markets traded 1.0% higher.
- US futures are trading slightly lower.
Economic reports due out (all times are eastern): International Trade (8:30am), Jobless Claims (8:30am), Wholesale Trade (10am), EIA Natural Gas Report (10:30am)
Technical Outlook (SPX):
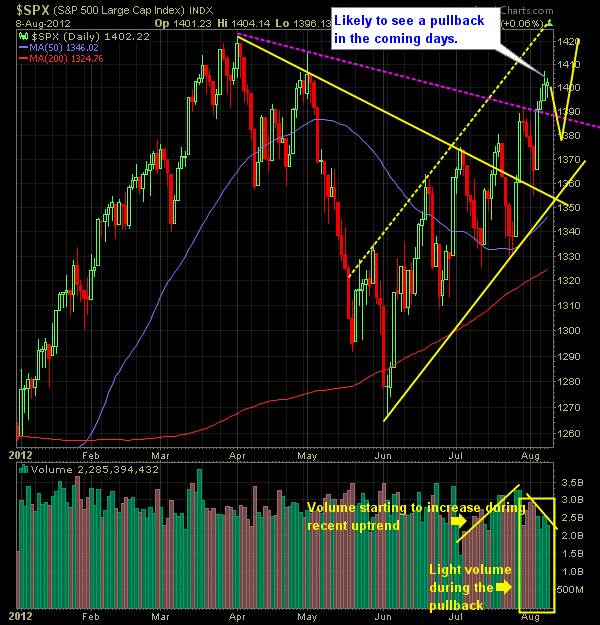
- Fourth straight day of gains in the SPX.
- Low volume continues to be the norm for the rally over the same time period.
- Market remains well overbought on multiple time frames.
- Solid higher-high with doji-hammer candle yesterday, could be the signal for a pullback here.
- For a while, the rally off of the 6/4 lows looked more like a bear-flag forming, but no longer with the strength in the market over the last month.
- If the SPX is to finish again in the green today, it would be the first 5-day rally since the 3/7-3/12 period from earlier this year.
- SPX poised to make a move to 1422 and challenge the year’s highs.
- Biggest news so far this week, technically, has been the SPX breaking out of the descending trend-line off of the 4/2 highs (as noted below).
- Volume continues to be extraordinarily light over the past few days and if you compare it to this time last year, it is as much as 30% less.
- It’s not uncommon to see large market rallies going into an incumbent re-election – (post later on this today).
- 30min chart is beginning to look like a head and shoulders pattern, which spells trouble for the markets, if the neckline of the pattern confirms.
- If you look at the 4 previous higher-highs in the market since the 6/4 bottom, then one could conclude that we’ve reached another temporary top, and are prime for another pullback.
- One area of concern is the 3 large gaps off of the 6/4 lows that remain unfilled, including 6/6, 7/26, 8/3
- At this point, uptrend support rests at 1353.
- SPX trading above all significant moving averages (10,20,50,200).
- VIX had a large reversal yesterday and remains below 16
- If another sell-off were to ensue, watch for a break and close below 1354 for a new lower-low in the market.
- Downside reversal signal still remains intact on the SharePlanner Reversal Indicator.
My Opinions & Trades:
- Sold CNQ yesterday at $30.28 from $28.78 for a 5.2% gainer.
- If the market shows signs of getting top heavy and a possible pullback, I may consider adding 1-2 short positions to hedge my 4 current long positions.
- Market could rally higher at this point, but I’d rather wait for a pullback occur first before increasing my long exposure.
- Remain long RHT at $56.19, AIG at $32.46, MDT at 38.15 and AMZN at $233.90. Short BRO at $25.65
Charts:

