Pre-market update (updated 8am eastern):
- European markets are trading 0.2% higher.
- Asian markets traded trading mixed/flat.
- US futures are slightly higher.
Economic reports due out (all times are eastern): Consumer Price Index (8:30am), Housing Starts (8:30am), Jobless Claims (8:30am), Philadelphia Fed Survey (10am), EIA Natural Gas Report (10:30am),
Technical Outlook (SPX):
- Market followed through yesterday and pushed higher after a breakout day prior to.
- Yesterday might have been one of the weakest ‘up-days’ in the market that I have seen in a long time. Breadth was incredibly weak, and not many stocks participated in the rally.
- Volume is getting notably stronger of late, and continues to increase day-after-day.
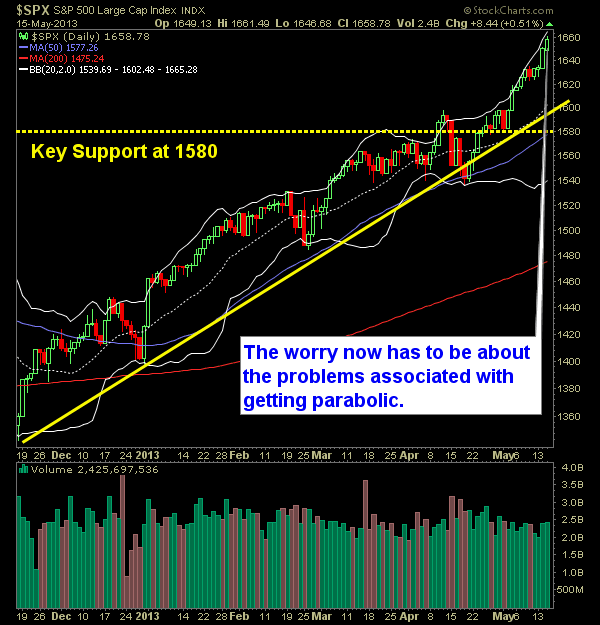
- I have big reservations about whether this market can truly get up to 1700. It has gone straight up since crossing 1600, and bulls have become gluttons in their market outlook.
- I am getting worried about this market as it is starting to look undoubtedly parabolic.
- With that said, the only option for trading right now is still to the long side. You just have to protect your capital at all costs. Don’t allow for big losers and keep stops tight.
- Traders will point at the fact that we are overbought but we have been since April – move on, nothing to see there.
- We have traded above the 10-day moving average for 17 straight sessions, which is a great sign of strength.
- 16 out of the last 19 sessions has resulted in a bullish move for the SPX. Futile to try to call tops on this market right now… let the price action come to you.
- I don’t mind adding more positions to the portfolio at these levels, but while I do that, I am tightening my stops in my existing positions to protect profits and reduce exposure. I recommend you do the same if you are going to increase your exposure.
- Essentially, the market has previously been working off overbought conditions via intraday pullbacks.
- A lot of the real estate that the Bollinger Bands were providing for a push higher has been used up. Going into today, there is a about 13 points to work with before you need to become cautious of your long exposure.
- If it were up to me, I’d like to see the SPX pullback over multiple days to the 1600 level.
- 30-minute charts shows an overextended market but with support at 1634.
- As long as the SPX doesn’t break 1580, any pullback we experience should be just fine and keep the bullish sentiment in place.
- A push above the upper Bollinger band would likely result in a climatic top.
- We are up seven straight months, the last time we saw such a rally was when the market bottomed in 2009.
- Continue trading to the long side while the bullishness continues. No need to try to call a top on this market when it shows no desire to do so. Don’t try to be a hero in your trading.
- Markets don’t care about the economy. That is not what is driving them. The markets only care about what the Fed is doing to keep equities propped up.
- We haven’t seen a market pullback in excess of 4% since October/November time-frame.
My Opinions & Trades:
- No new trades yesterday.
- Stopped out of SLB yesterday at $75.45 for a 2.1% loss.
- Will probably look to do the following: Close out 1-2 new positions and tighten my stop-loss on remaining ones.
- Remain Long RLGY at $48.49, JCI at $35.22, GRA at $79.03, SLB at $77.03, WOOF at $24.40, DG at $52.75, CMG at $374.07, AAP 86.07.
- Join me each day for all my real-time trades and alerts in the SharePlanner Splash Zone
Chart for SPX:

