
I’ve long been a fan of trading on multiple time-frames with daily being my primary chart-of-choice.
As a swing-trader, I rely heavily on other time frames like the 30-minute for determining my entry intraday and then the weekly to see if there are any longer-term problems that are coming to the surface that the daily doesn’t clearly show.
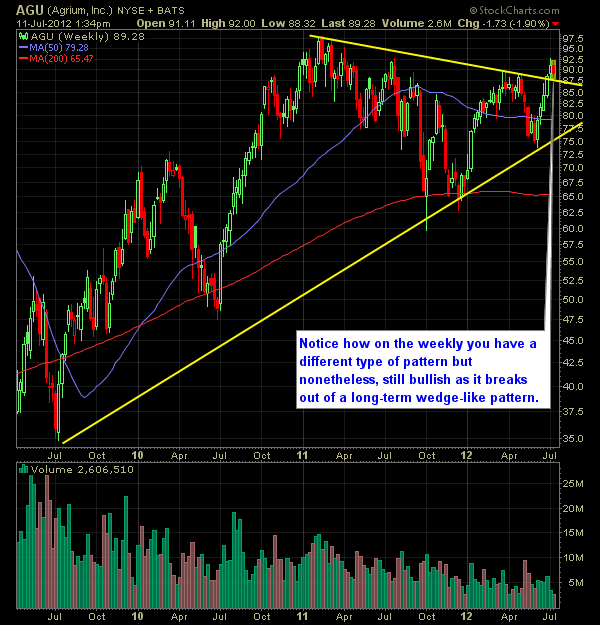
I took a trade in Agrium (AGU). It doesn’t have any flashiness/excitement to it, but it does show on multiple time frames how the bulls clearly have the upper-hand. As a result, I’m taking the recent weakness to establish a long position at current support levels with a tight risk and favorable reward scenario.
Here’s the daily chart for Agrium (AGU):

Now take a look at its weekly and different look that it exhibits.


Welcome to Swing Trading the Stock Market Podcast!
I want you to become a better trader, and you know what? You absolutely can!
Commit these three rules to memory and to your trading:
#1: Manage the RISK ALWAYS!
#2: Keep the Losses Small
#3: Do #1 & #2 and the profits will take care of themselves.
That’s right, successful swing-trading is about managing the risk, and with Swing Trading the Stock Market podcast, I encourage you to email me (ryan@shareplanner.com) your questions, and there’s a good chance I’ll make a future podcast out of your stock market related question.
It's 2025 and we have for ourselves a stock market correction. I get that some people are calling it a stock market crash already, but that is certainly pre-mature and short-sighted. Let's call it for what it is right now, and that is a stock market correction. In this podcast episode, Ryan discusses how important it is to be risk managers in our trading and how we can weather the storms of the market and even profit from a stock market correction. This is an incredibly important podcast episode that you won't want to miss!
Be sure to check out my Swing-Trading offering through SharePlanner that goes hand-in-hand with my podcast, offering all of the research, charts and technical analysis on the stock market and individual stocks, not to mention my personal watch-lists, reviews and regular updates on the most popular stocks, including the all-important big tech stocks. Check it out now at: https://www.shareplanner.com/premium-plans
📈 START SWING-TRADING WITH ME! 📈
Click here to subscribe: https://shareplanner.com/tradingblock
— — — — — — — — —
💻 STOCK MARKET TRAINING COURSES 💻
Click here for all of my training courses: https://www.shareplanner.com/trading-academy
– The A-Z of the Self-Made Trader –https://www.shareplanner.com/the-a-z-of-the-self-made-trader
– The Winning Watch-List — https://www.shareplanner.com/winning-watchlist
– Patterns to Profits — https://www.shareplanner.com/patterns-to-profits
– Get 1-on-1 Coaching — https://www.shareplanner.com/coaching
— — — — — — — — —
❤️ SUBSCRIBE TO MY YOUTUBE CHANNEL 📺
Click here to subscribe: https://www.youtube.com/shareplanner?sub_confirmation=1
🎧 LISTEN TO MY PODCAST 🎵
Click here to listen to my podcast: https://open.spotify.com/show/5Nn7MhTB9HJSyQ0C6bMKXI
— — — — — — — — —
💰 FREE RESOURCES 💰
My Website: https://shareplanner.com
— — — — — — — — —
🛠 TOOLS OF THE TRADE 🛠
Software I use (TC2000): https://bit.ly/2HBdnBm
— — — — — — — — —
📱 FOLLOW SHAREPLANNER ON SOCIAL MEDIA 📱
X: https://x.com/shareplanner
INSTAGRAM: https://instagram.com/shareplanner
FACEBOOK: https://facebook.com/shareplanner
STOCKTWITS: https://stocktwits.com/shareplanner
TikTok: https://tiktok.com/@shareplanner
*Disclaimer: Ryan Mallory is not a financial adviser and this podcast is for entertainment purposes only. Consult your financial adviser before making any decisions.
You Might Like

January Barometer: As January Goes

Swing Trading the Holidays

Managing Portfolio Volatility In Your Swing Trading