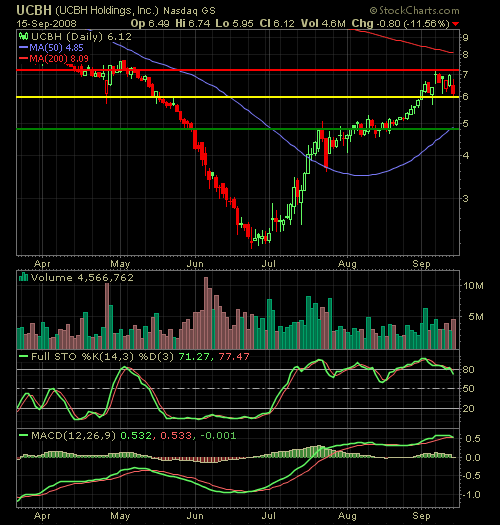
Here’s a short that provides you with all the risk and all the reward one could ask for. I think this is a scary setup not knowning what the market’s response will be to the Fed today. While this stock dropped over 11% yesterday, it could nonetheless snap back hard later in the day with
Today is shaping up to be a pretty nasty day, and honestly, even our short positions both the one below, and the one being offered to Shareplanner Subscribers, may not hit, considering how far below our entry prices they are likely to open up at. Nonetheless, here is a short that I’m considering today. Remember,
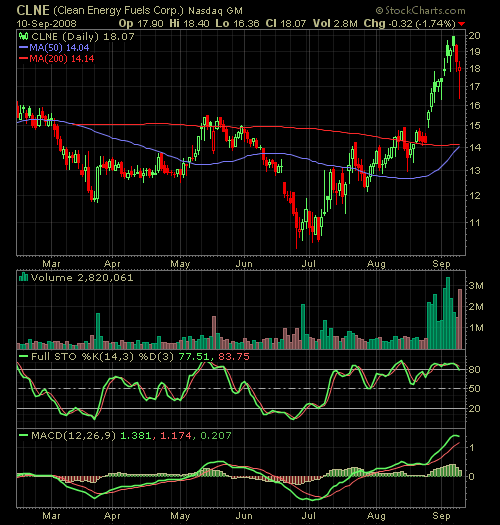
Here’s two charts for shorting possibilities. Three hours before the markets open, and the S&P and Nasdaq futures are down 12 and 19 points respectively. Neither of the two charts below are ones I am not totally sold on. CLNE, I believe, is being promoted by T. Boone Pickens, with his commercials on finding renewable
Morning futures are looking strong, but don’t take it for granted that we will bounce off of yesterday’s decline. As of this writing the Dow is up 74 points, Nasdaq is up 19 points, and the S&P up 8.5 points. Lehman (LEH) is taking some steps to try and fix their credit crunch as they
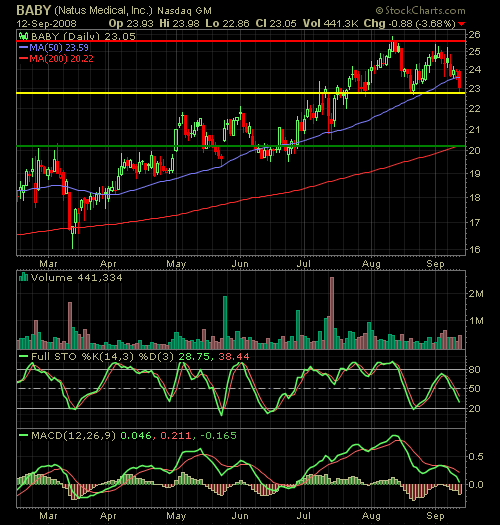
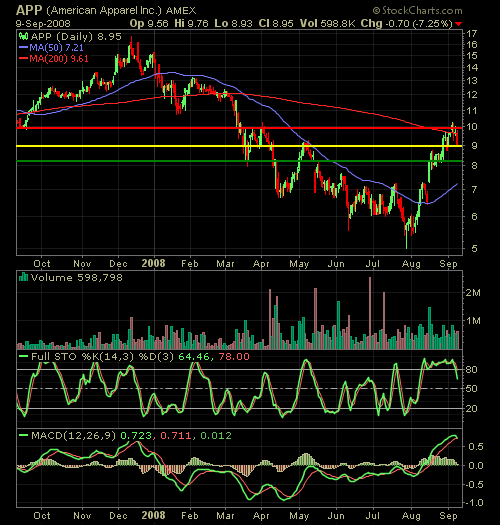
After yesterday’s losses on Wall Street, it looks like we’ll be seeing some follow through this morning after unemployment hit 6.1%. In any case, lets take a look at the charts below. Green line is our intial target, Yellow is our potential entry and red is probably where we’d look to get out if the
Here’s a chart to consider for tomorrow. AMD is a stock I’m sure most of you have heard of. We’ve bought and sold this one a few times in the past. They are actually a pretty good company, but in a very competitive industry that has seen its prices for components slashed drastically over the
We’ve received requests recently to post some charts on USO. We actually closed out our position in USO this morning, but nonetheless, let’s go over the charts with everyone. Here’s the daily chart:
With all the talk of oil and its rapid increase in price. Let’s explore the technical side of it by dissecting the USO chart – and ETF that’s value is tied to the price of oil. Here is our first chart of oil in which we are drawing a trend line for from January 2007
May 8, 2008 Trends are often what we look for when finding a stock to trade in. For those who depend on technical analysis solely for their trading decisions, it is their life-blood. Knowing where big money is putting there money in, is often found by spotting the trend early and riding it to maturity.
