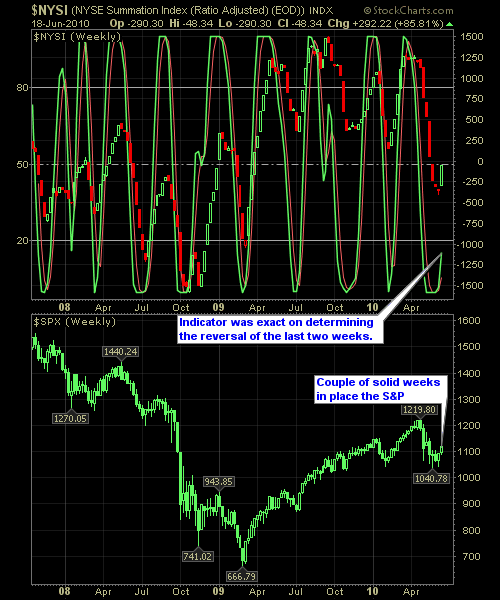
Here is the weekly update on the NYSE Reversal Indicator using the advance/decline ratio with a stochastics overlay. The bottom half of the chart is the weekly candles of the S&P. The chart itself goes back almost three years. Some folks have criticized me for posting this chart recently saying that it isn’t 100% accurate – but if it was as some think it must be in order to post then 1) I wouldn’t be posting it – I’d save it all for myself 2) I would sell it to Goldman Sachs for an ungodly sum of money. But it isn’t perfect (I wish it was) and there is always a level of error that you can expect from it. But overall, it is fairly accurate, and when the indicator hits certain extremes on the stochastics, it is often a good time to start hedging positions that are going against the direction of the indicators, or start loading up on short or long positions in respect to the direction that the indicator itself is pointing to.
So no, it is not 100% accurate and you are fool tho think otherwise. But it is a good indicator of when one should start showing a more bullish/bearish tone when the market reaches those certain extreme levels.
Here is the NYSE Reversal Indicator.

