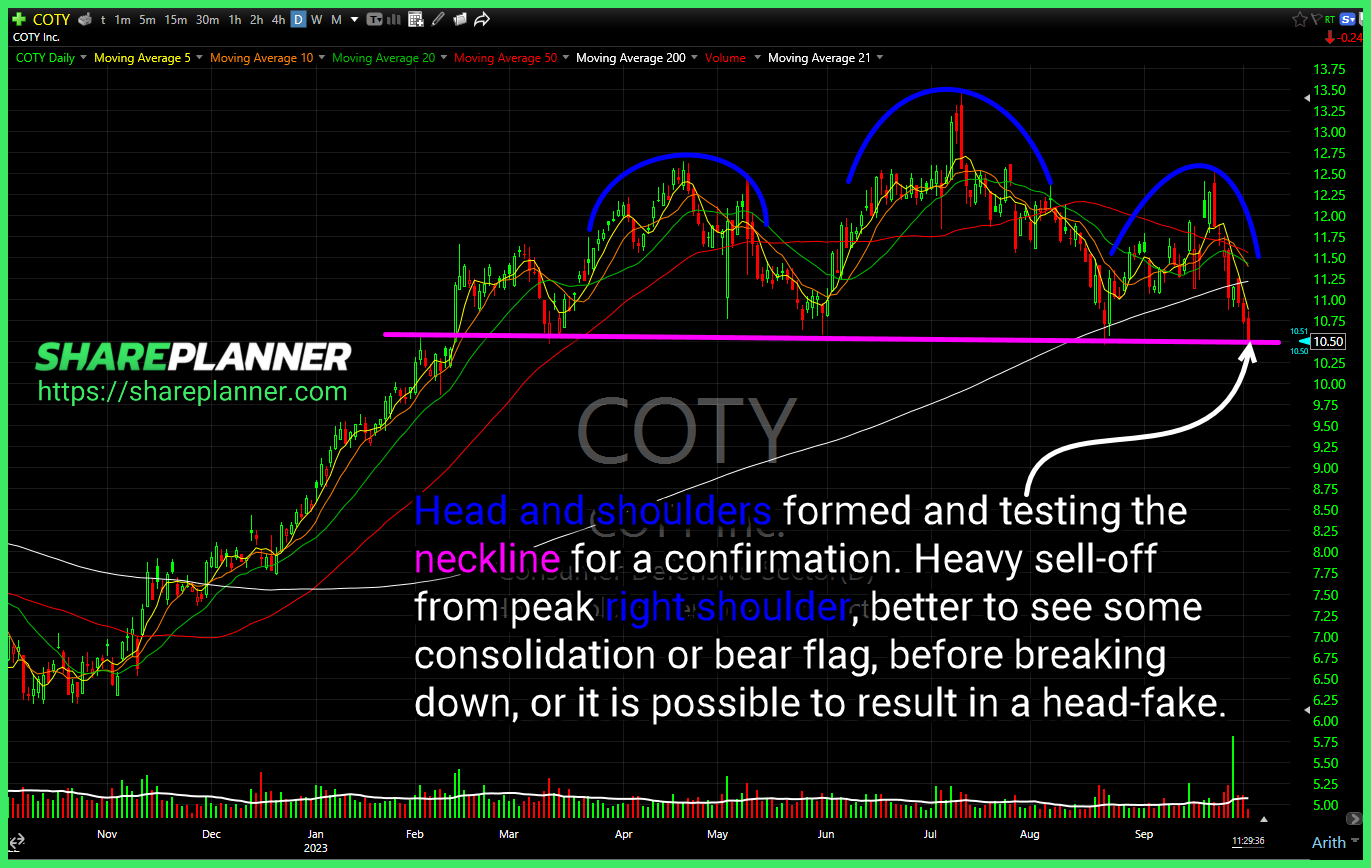
$COTY Head and shoulders formed and testing the neckline for a confirmation. Heavy sell-off from peak right shoulder, better to see some consolidation or bear flag, before breaking down, or it is possible to result in a head-fake. $NEP has all-time lows in sight, and now sporting almost a 14% dividend yield. $NEE pullback has
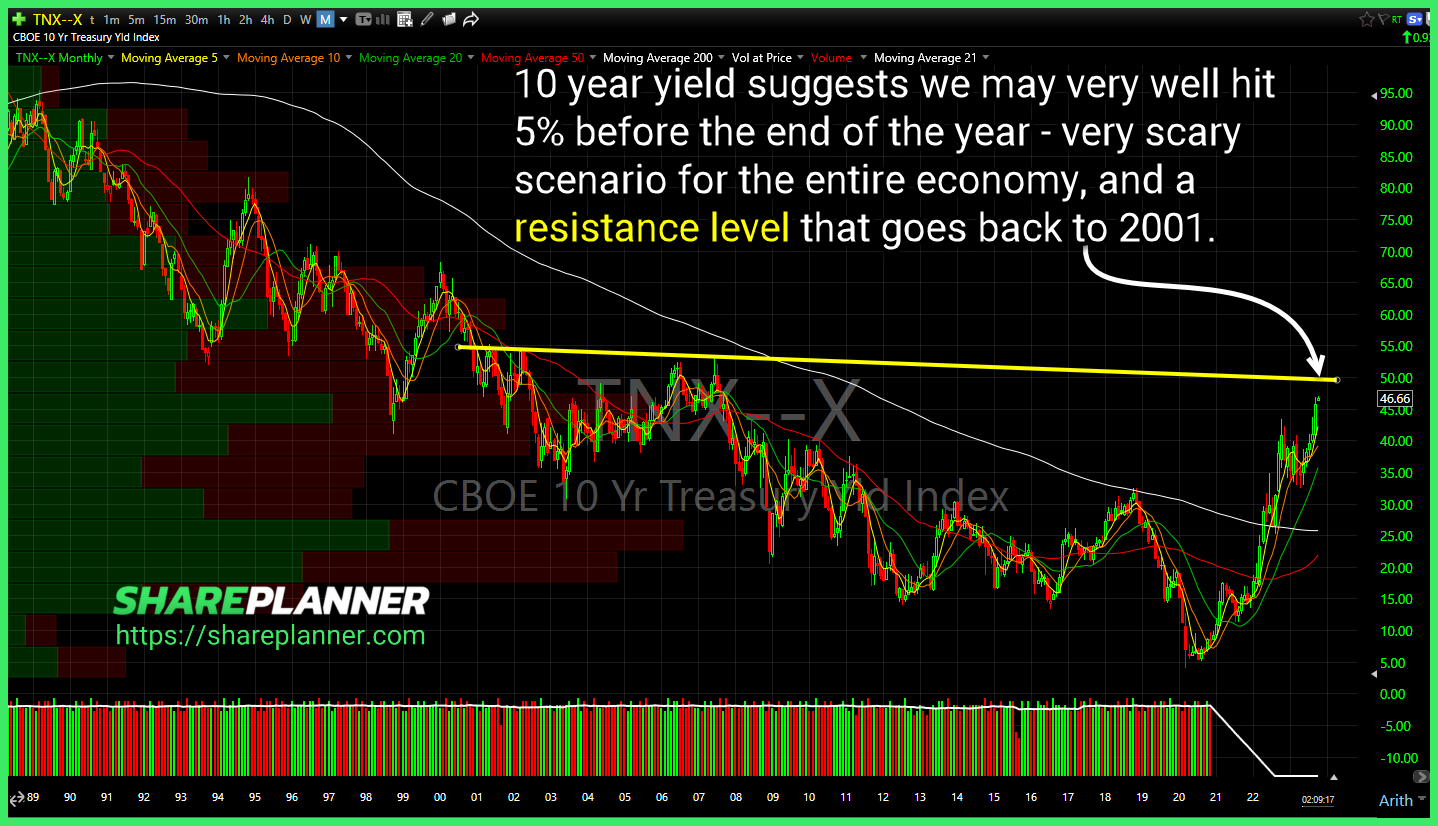
$TNX 10 year yield suggests we may very well hit 5% before the end of the year - very scary scenario for the entire economy, and a resistance level that goes back to 2001. Looking more and more like $TGT will ultimately, get to $94 for a test of long-term support. I won't looking to
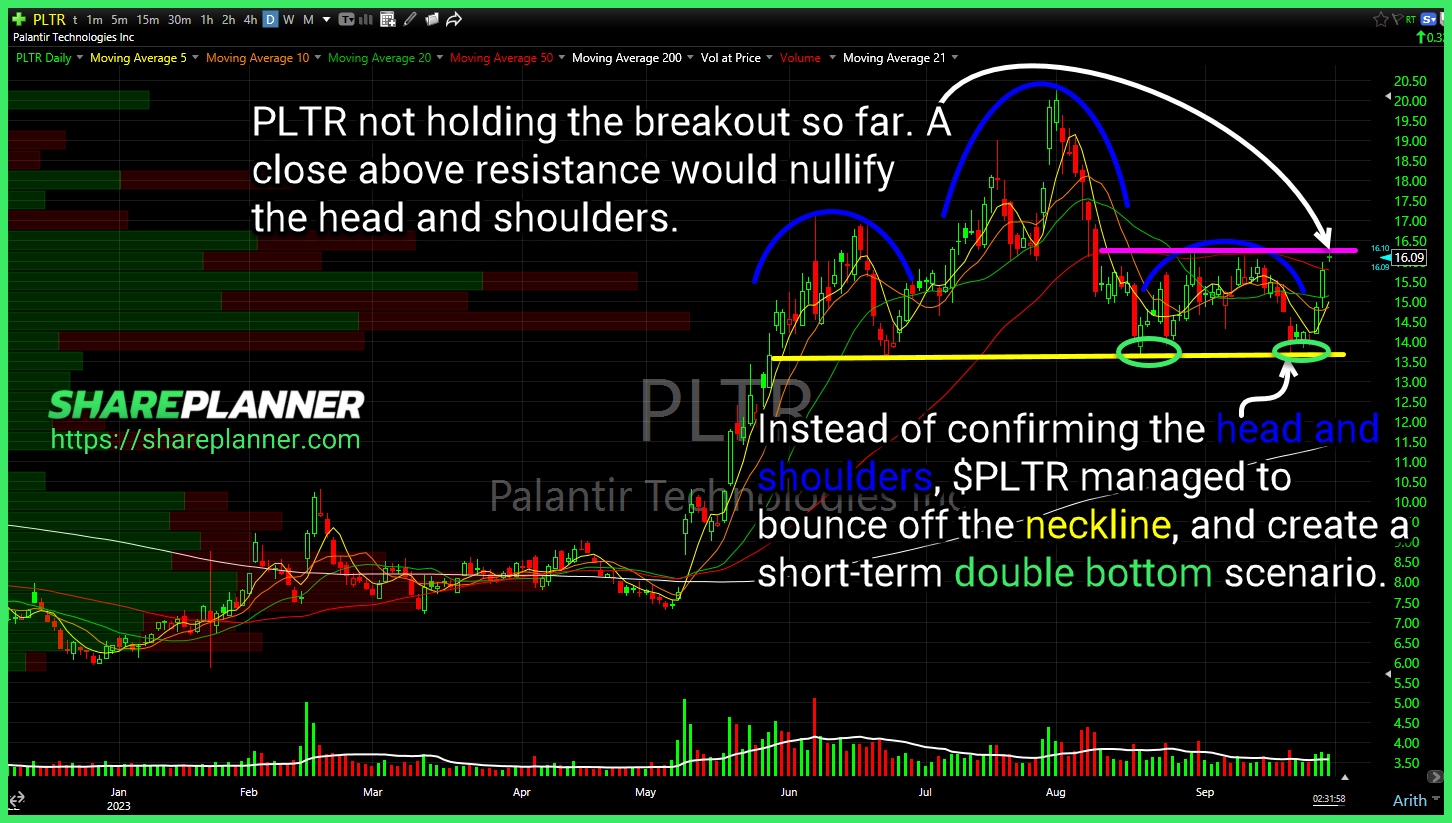
Instead of confirming the head and shoulders, $PLTR managed to bounce off the neckline, and create a short-term double bottom scenario. $F has a promising setup if it can break through short-term consolidation, but it is also dealing with heavy rejection at the 200-day moving average. $CCL needs to hold key support here at $13.70,
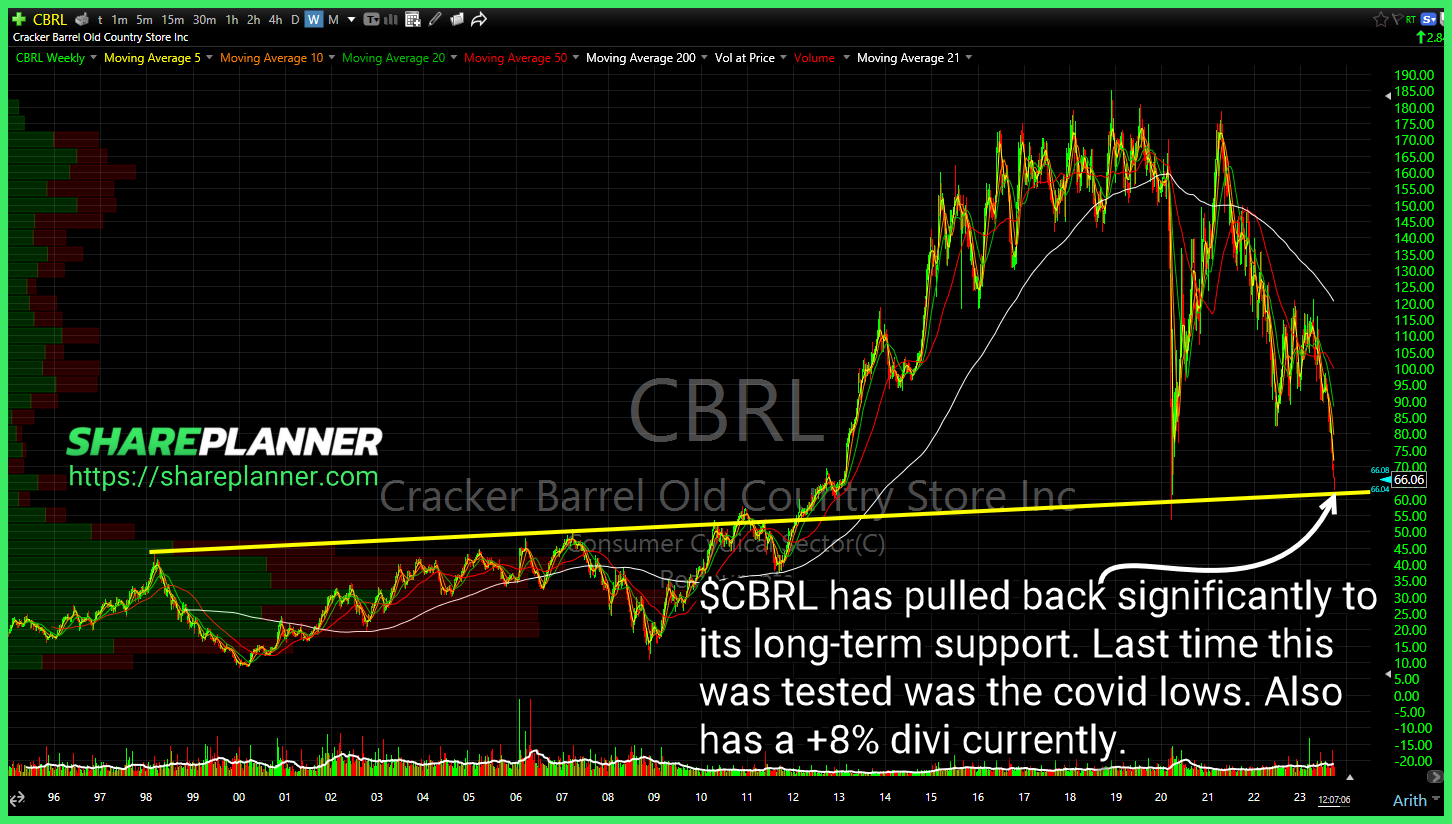
$CBRL has pulled back significantly to its long-term support. Last time this was tested was the covid lows. Also has a +8% divi currently. $GME couldn't hold the break above the declining trend-line. $UNH Retest of the declining trend-line and subsequent bounce from there. May encounter some resistance at $515. $AAPL testing a major support
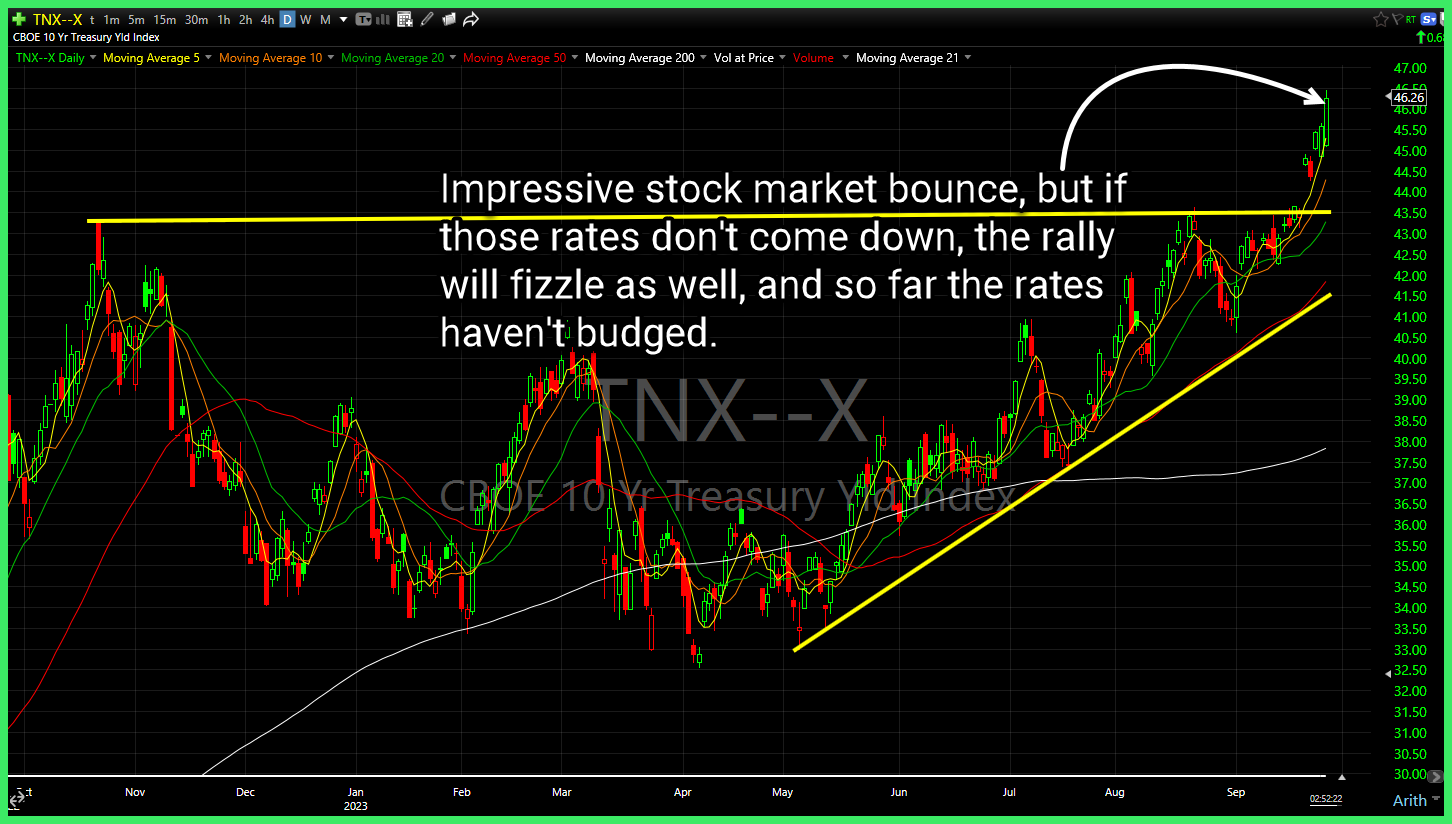
Impressive stock market bounce, but if those rates don't come down, the rally will fizzle as well, and so far the rates haven't budged. $TNX $NEE nearing the closest thing to support at $59. Losing $70 was a big deal, but very oversold on daily, weekly and monthly charts. $AROC breaking through resistance. If I
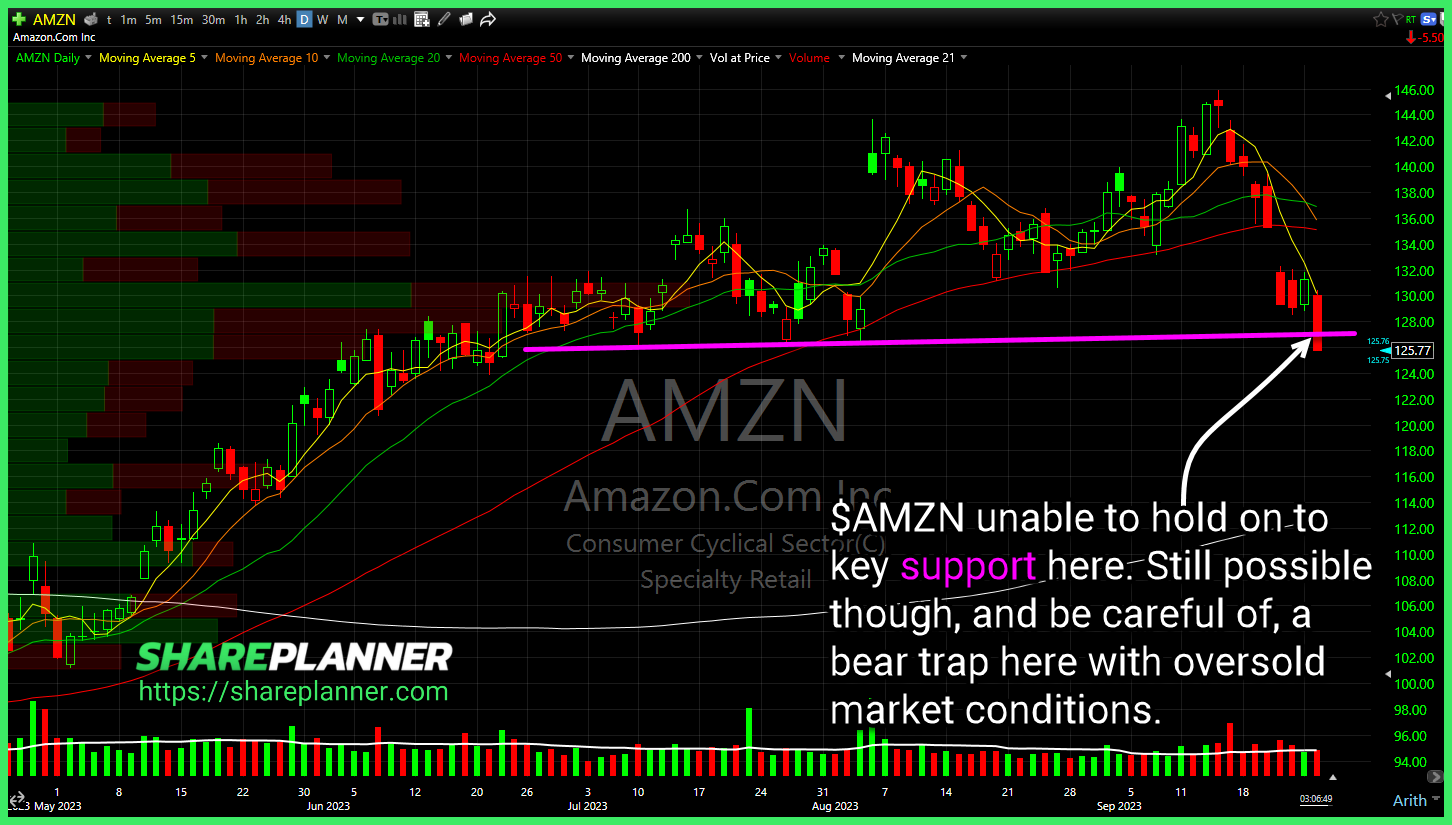
$AMZN unable to hold on to key support here. Still possible though, and be careful of, a bear trap here with oversold market conditions. Ideal conditions for $URA entry would be on a pullback to the rising trend-line once a bounce materializes. Buying here at overextended levels, creates a high risk scenario with limited reward.
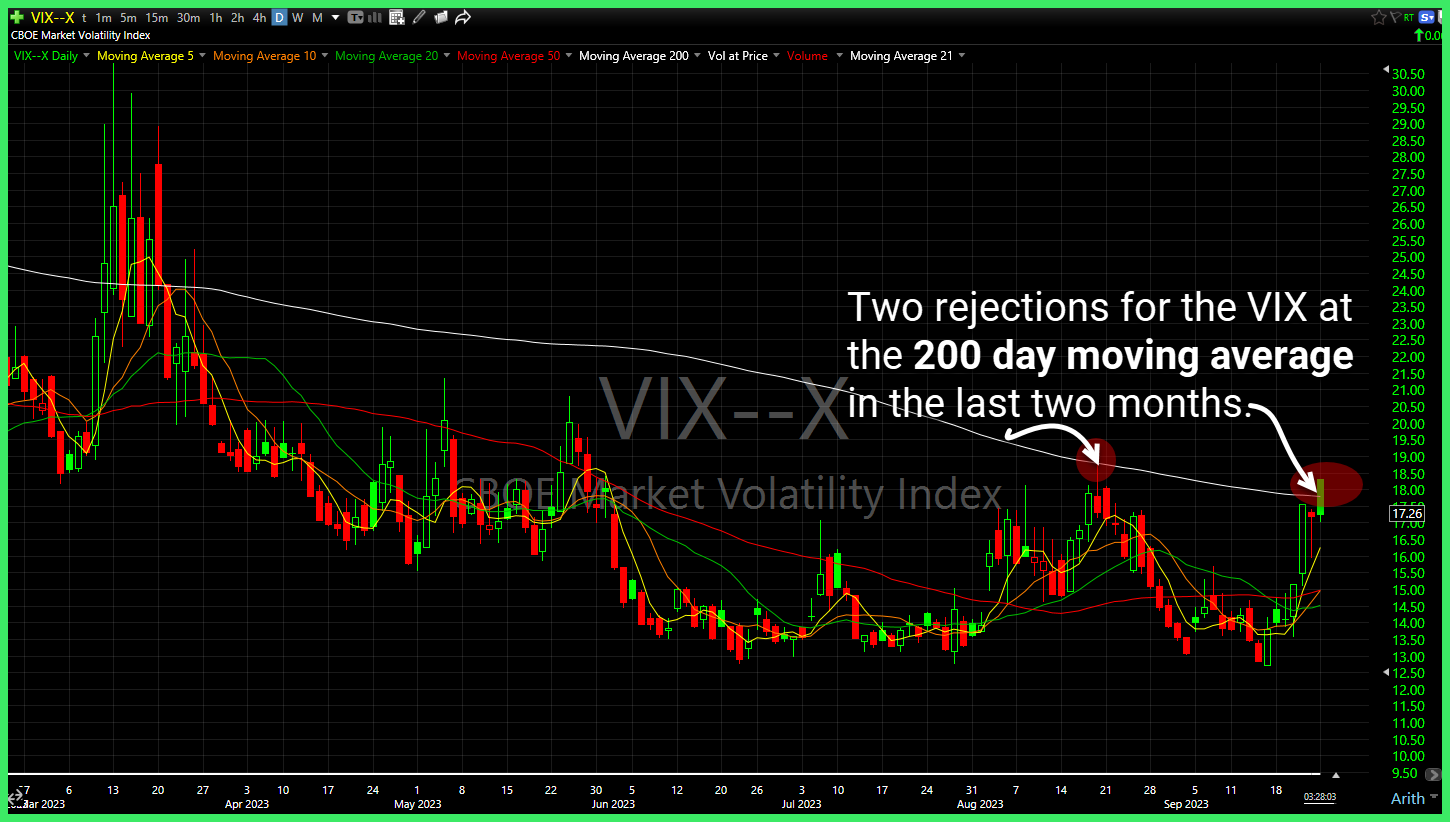
Two rejections for the $VIX at the 200 day moving average in the last two months. $X testing short-term resistance for a possible breakout. Something is begging to break right now. $TLT is heading for lows not seen since 2007. Two Rising trend-lines to watch on $ON.
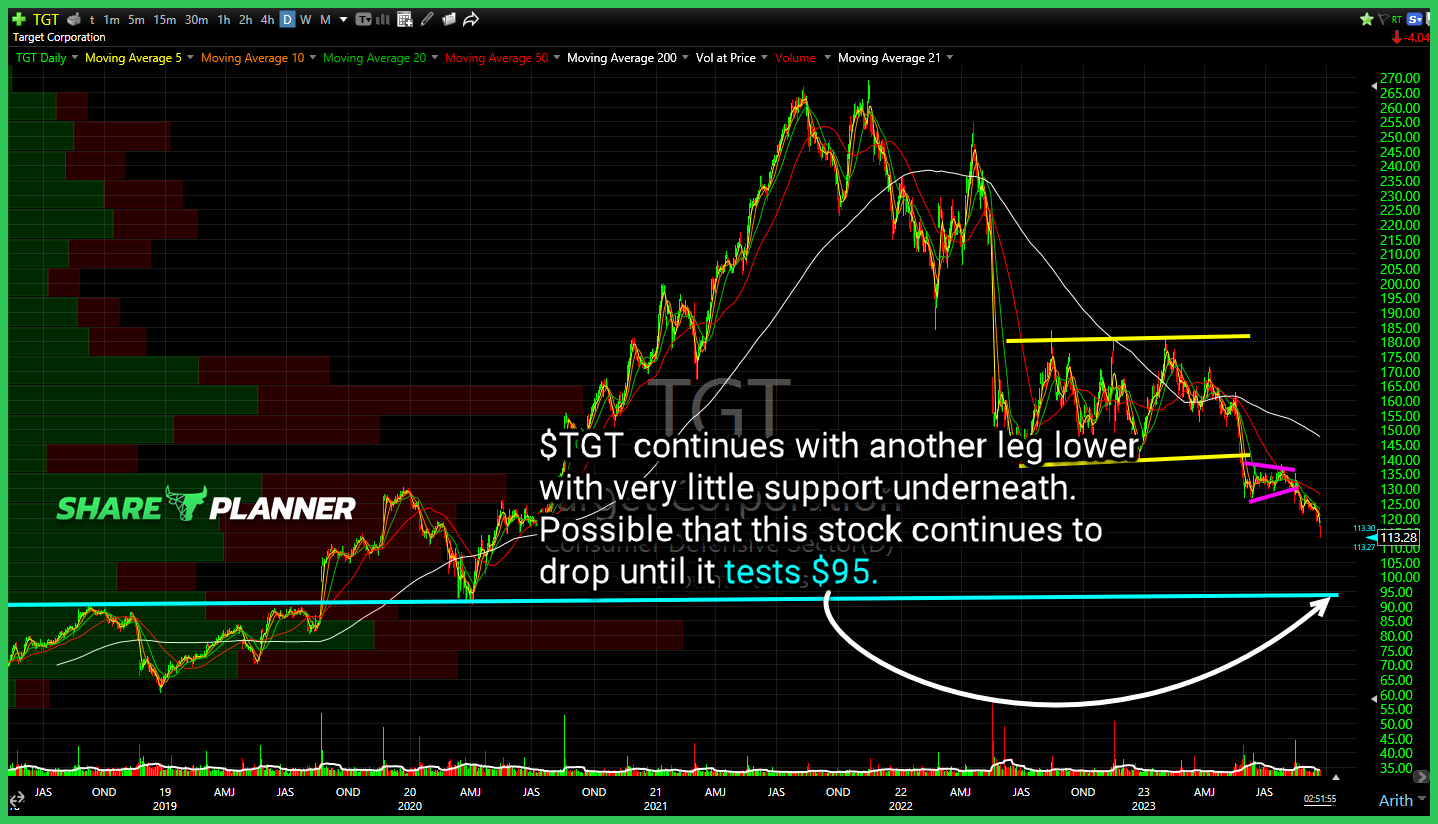
$TGT continues with another leg lower with very little support underneath. Possible that this stock continues to drop until it tests $95. $SOFI confirming that head and shoulders, with little support underneath. Next level is $6.50 followed by $5.25. $RCMT testing key resistance. A push above would create a breakout scenario.
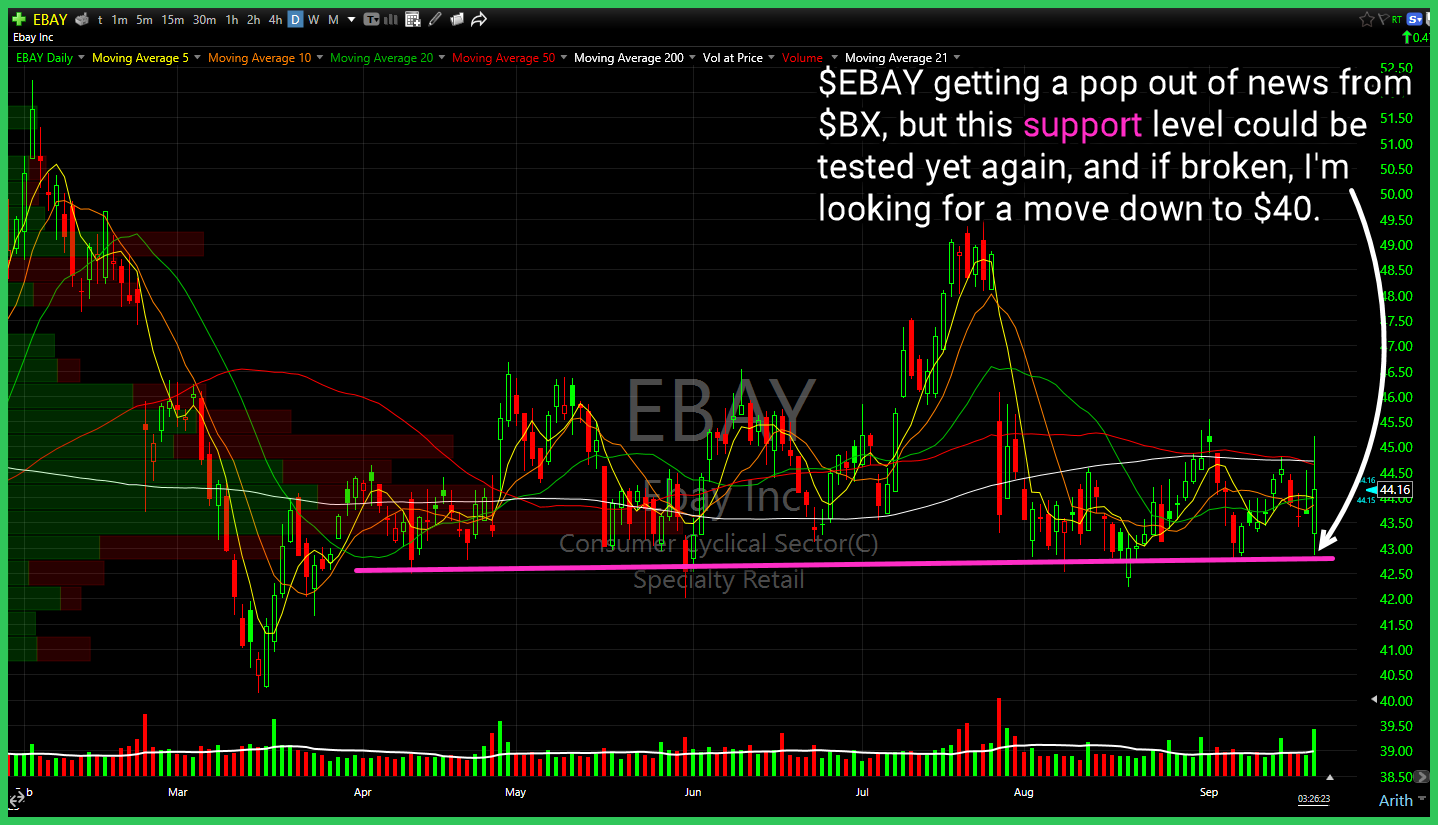
$EBAY getting a pop out of news from $BX, but this support level could be tested yet again, and if broken, I'm looking for a move down to $40. Good chance $VIX gets to test the $18 level. Long-term trend-line for $MSFT was broken yesterday, and now attempting to hold a key support level in
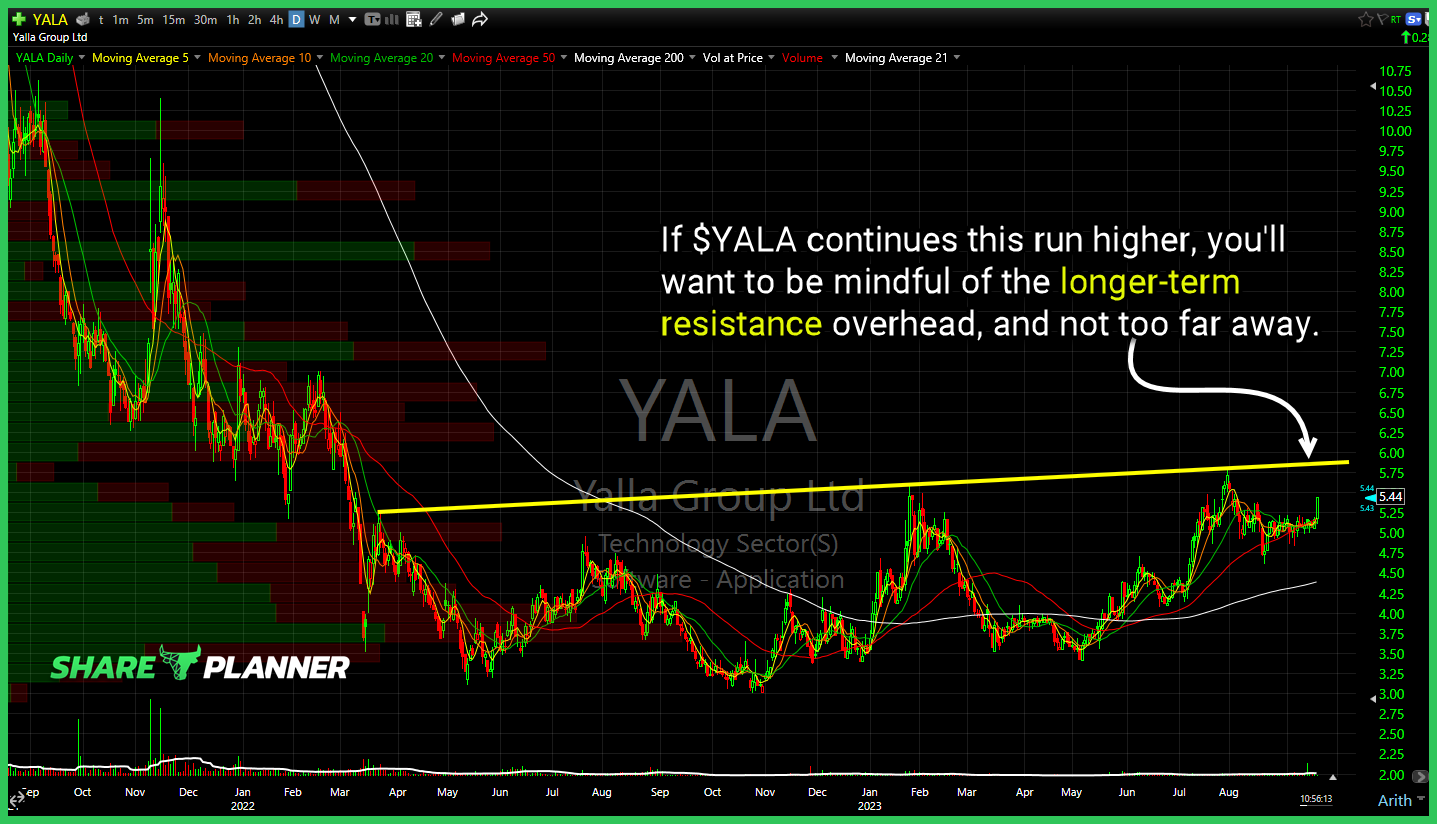
If $YALA continues this run higher, you'll want to be mindful of the longer-term resistance overhead, and not too far away. Nice bull flag in $CMPR weekly forming, and also testing the 200-day MA. Be aware though, if it starts to run of the declining resistance that goes back to 2018 $MTG continuation triangle formed,

spc@shareplanner.com
(321) 522-6733
© Copyright 2025 | SharePlanner Inc. All Rights Reserved.
Disclaimer: The information provided on this website is for educational and informational purposes only. Ryan Mallory and/or SharePlanner are not licensed financial advisors, brokers, or tax professionals. The content on this site should not be considered as financial, investment, tax, or legal advice.
All information and opinions expressed herein are based on sources believed to be accurate and reliable. However, we make no representation or warranty as to their accuracy, completeness, or reliability. Any action you take upon the information on this website is strictly at your own risk.
Past performance is not indicative of future results. Investing involves risk, including the possible loss of principal. All investors should make their own decisions based on their specific investment objectives and financial circumstances.
This site may contain links to external websites that are not provided or maintained by or in any way affiliated with Ryan Mallory and/or SharePlanner. Please note that Ryan Mallory and/or SharePlanner do not guarantee the accuracy, relevance, timeliness, or completeness of any information on these external websites.
By using this website, you agree that Ryan Mallory and/or SharePlanner and any affiliated parties are not responsible for any losses or damages resulting from your use of or reliance on the information provided.
It is strongly recommended that you consult with a qualified professional before making any financial decisions.