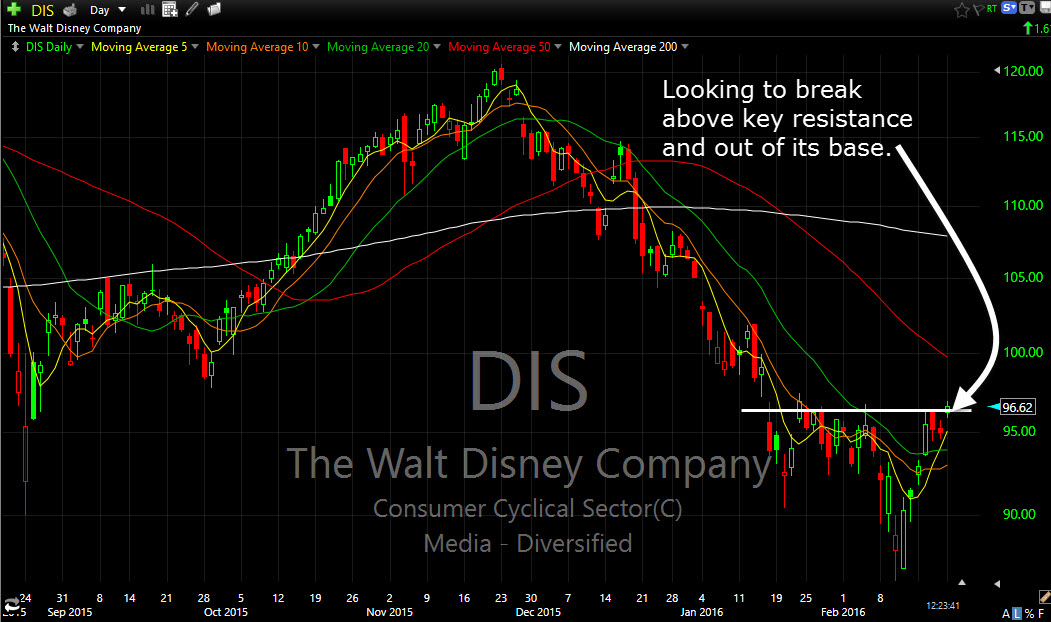
2/22: Breaking above key resistance today, with a potential move back above $100. Again another stock that has been hammered by the street of late, formed a nice base, and now looking to break out above that resistance.
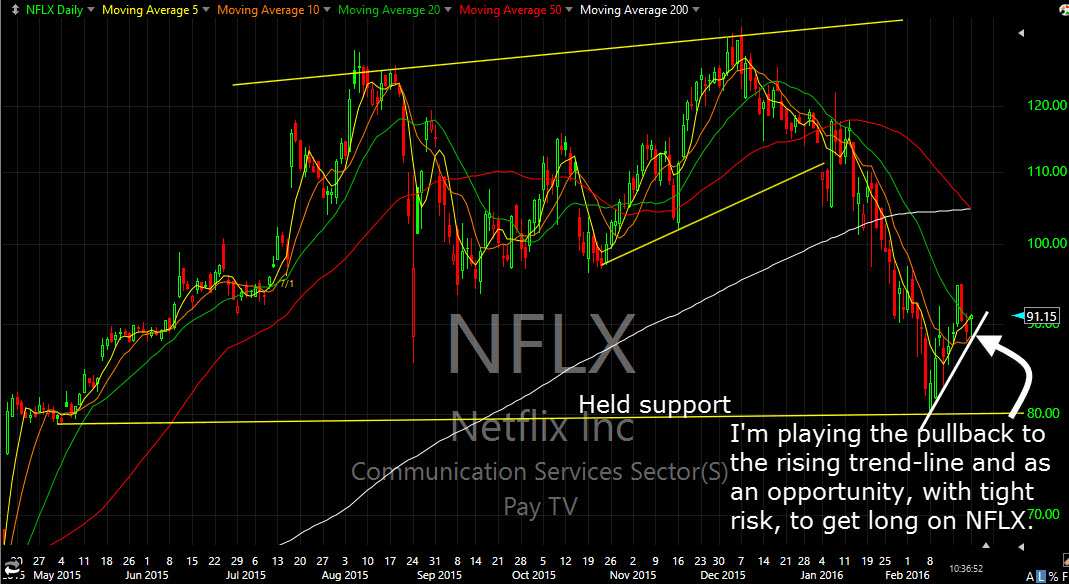
2/22: Bottomed off of key support at $80 on $NFLX back on 2/8. WIth market strength, traders are looking to buy stocks that have been beaten down from the past sell-off. NFLX has managed over the past two trading sessions to put in a higher-low, and looking to pop higher again. I'm going long on
Last week followed through on the previous week's sudden surge in the market. There was plenty of reason to be skeptical of rally initially, particularly with the premise that it was built and bottomed on an incorrect headline out of the Wall Street Journal saying that OPEC was willing to cut oil production. Then of
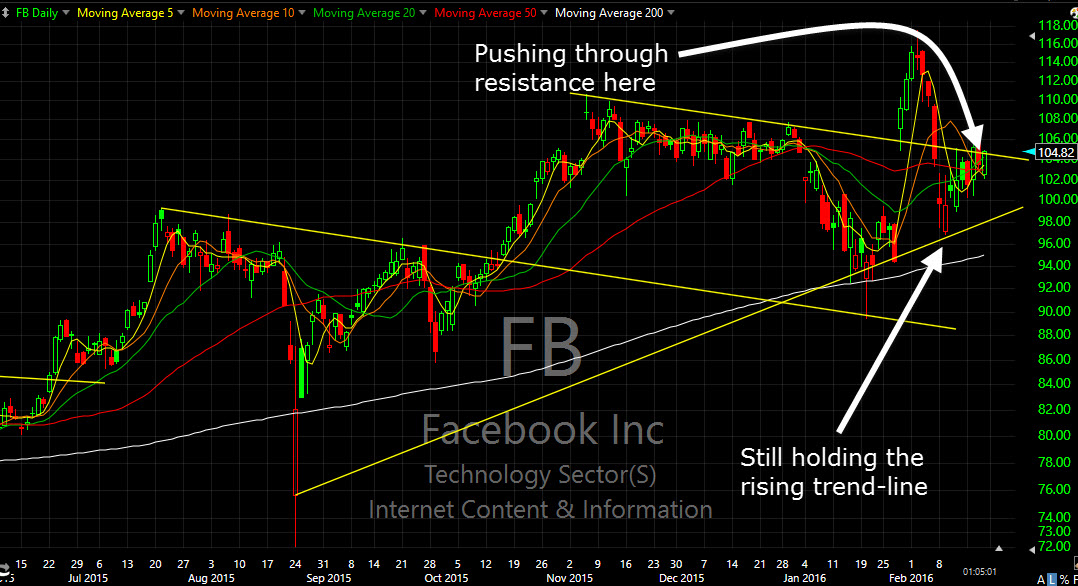
2/19: FB starting to get interesting again, after bouncing off of the rising trend-line from the 8/24 open price. and now breaking through a conglomerate of moving averages that include the 5, 10, 20 and 50-day, with none overhead. Very possible, if the market holds up that there is a retest of all-time highs again.
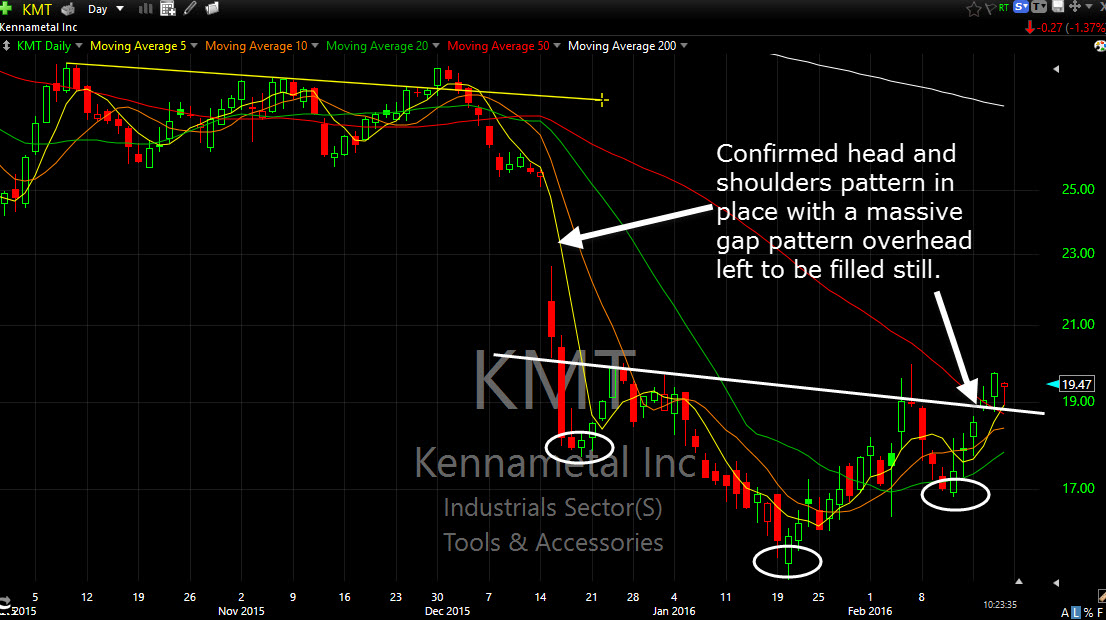
KMT Swing Trade 2/19: Nice downtrend still in place on $QQQ with lower-lows and lower-highs in place. QQQ tested yesterday and failed to break through declining resistance from the 1/13 highs.
Considering the market had another down week where it finished 0.8% lower, and prior to Friday's rally it was down 2.8%. Finishing the week in the green in the Splash Zone is always a plus in these types of market environments. Furthermore the insane pre-market moves that are unfolding well before the opening bell makes
The S&P 500 was down -3.1%, Nasdaq was down -5.4%, Dow was down -1.5%, and Russell was down -4.7% last week. The churning in the market during the first four trading sessions of last week was difficult to gain any kind of traction in the market, but we kept stops tight and when the market
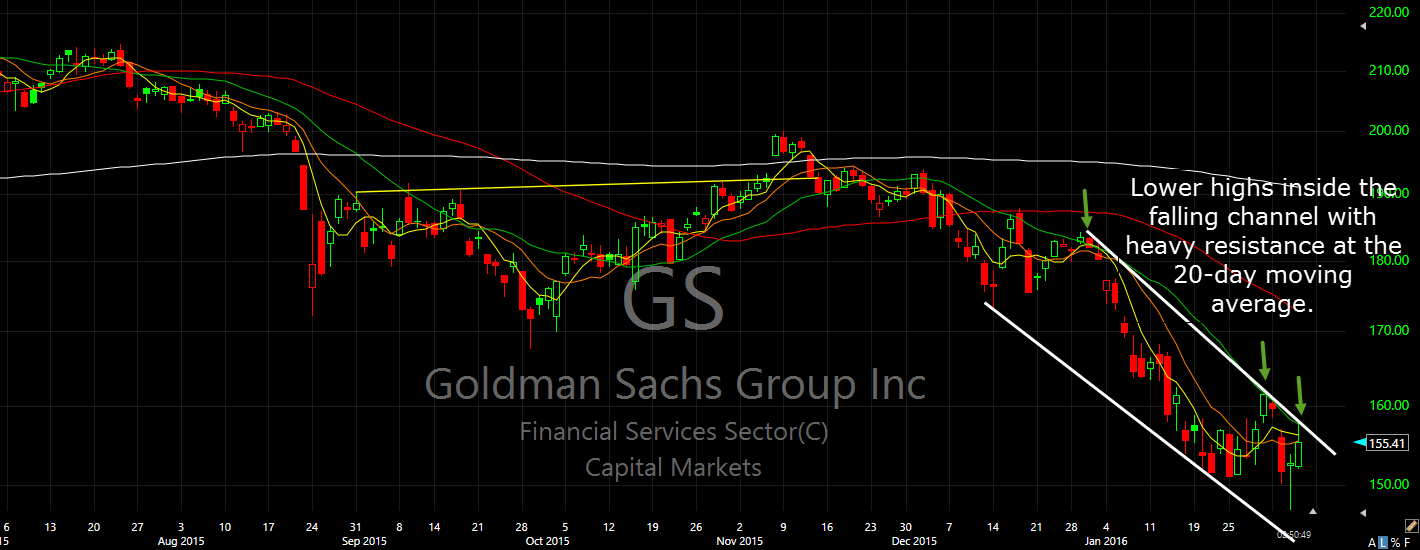
2/4: Heavy resistance on $GS on the declining 20-day moving average. Also resistance in the form of the 5 and 10-day moving averages as well. Established lower highs and lower lows and on the weekly chart you have a major head and shoulders pattern that has confirmed and following two weeks of consolidation is showing
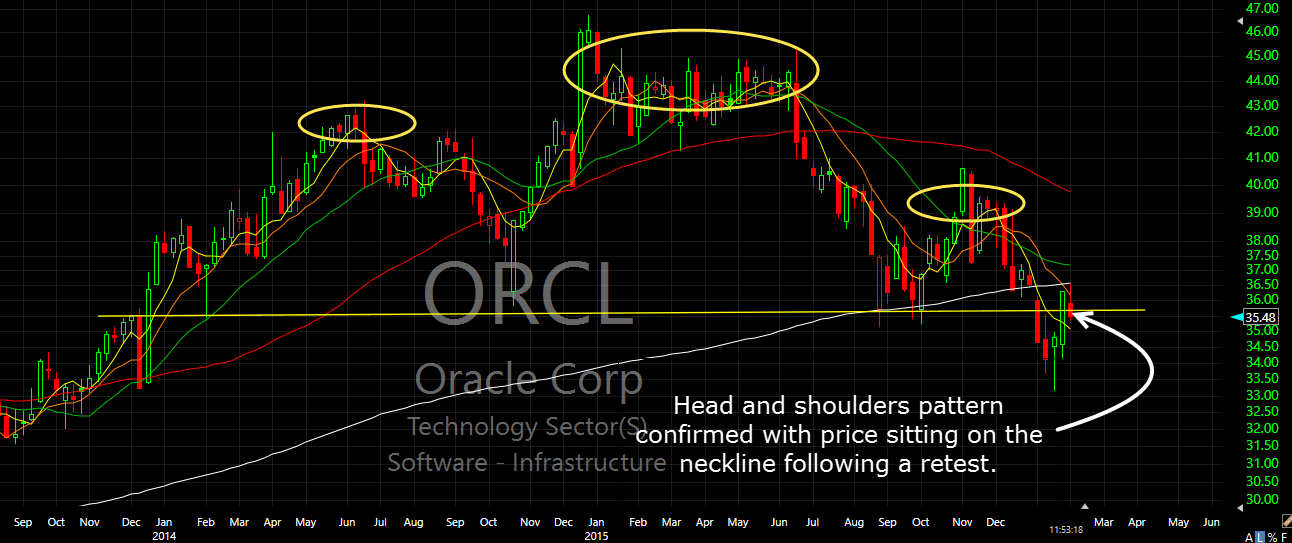
2/2: Bearish kicker pattern over the last two days where there was a strong green candle yesterday followed by a gap below the price range and a push lower today. But more so, I am interested in the massive head and shoulders pattern on the weekly chart that goes back more than a year, as
