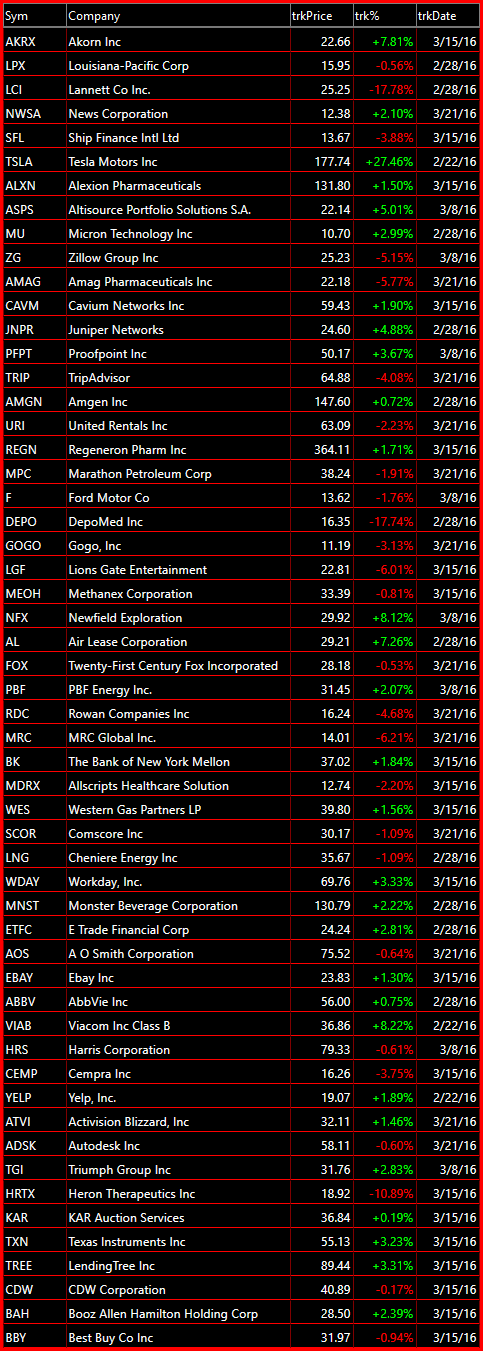
I like the trade setup in Tesla (TSLA) here. I think it provides a clear reward/risk parameter, and if earnings were not on August 3rd, a clear path to $270/share. With earnings you never know how things are going to turn out, which is why I don’t hold stocks through those events. It is simply
There is a strong level of resistance forming overhead on the Russell (IWM). On the RUT it is at the 1212-13 level and on IWM it needs to push through the $120’s. On numerous occasions IWM has tested this resistance level and has quickly retracted in price – often times to the tune of 7-10%.
Last week I wrote about there being some confusion on the SharePlanner Reversal Indicator. There were multiple reversals within a short time frame, and direction wasn’t entirely clear. With this week’s breakout to new all-time highs though, that confusion I spoke of, can be put to rest now. The direction issue has resolved itself on
Technical Outlook: SPX managed to rally above the 2111 resistance but was unable to close above said level into the close, which as you know, is what is most important. An intraday move above resistance holds very little meaning if SPX can’t hold it into the close and that is what we got yesterday. SPY
Stocks can go up and down all they want, but until there is a break out above or below of the 5-day trading range that price action has been stuck in on the 30 minute chart, there is little reason to get more long or more short. Right now I am 30% long, 10% short,
Technical Outlook: Massive, and very unexpected rally yesterday. The 5, 10, 20, and 50-day moving averages were smashed as if they didn’t even exist. The biggest issue at hand here is that the bulls could violate and nullify the head and shoulders pattern by having price break above the right shoulder at 2084. The longer-term
Technical Outlook: Another last minute save by SPX to rally price from negative territory to positive in the final 30 minutes. This is becoming the norm of late to spend the day in a weakened state only to rally in the final minutes. Massive head and shoulders pattern forming on the SPX 30 minute chart.
Technical Outlook: Three day rally this week continues to maintain a strong course higher that will likely test 2100 either today or next week. Since the initial break, volume has dropped each of the last two days and was dramatically weaker yesterday and well below recent averages. Personally, I wouldn’t be surprised to see the
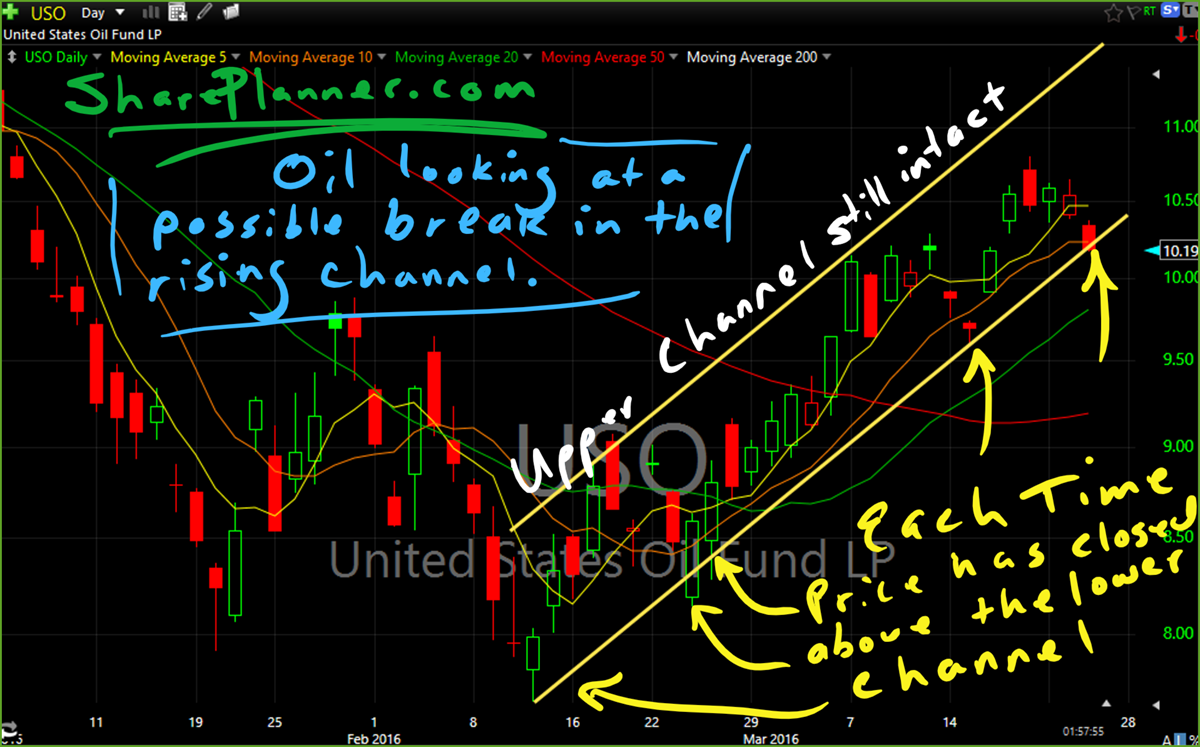
After breaking out of its recent base, oil has been on a roll, breaking out of its rising channel and crushing the hopes and dreams of bears wanting to see $20 oil. Now the question is, does the bears have a renewed sense of hope here with a possible break in the rising trend-line? We
I’m actually net short on this market – that is 10% short, 90% cash. I honestly see the reward being to the downside, while the market to the upside has hardly no reward until the market does in fact pullback. Basically the market is stuck in a conundrum. Bulls want this market to go higher,


