Here’s four dead cat bounces that I am watching closely if this market rally ends up failing. That doesn’t mean I am saying it will fail, that is me saying “IF” it fails. I have none of these as shorts, and am only looking to add them if the market conditions start showing signs of
Yes, I am speaking of the Oracle of Omaha – Warren Buffett. When it comes to technical analysis, I could care less who you are, if there is a trade setup,and it happens to be one where the risk is manageable, then yes, I will short you.
It is the same story that we have seen since February: the bears, in the first ten minutes of trading, come out looking like they want to drive the S&P 500 down 40 points on the day. Then suddenly, you use the bathroom and you come back to find they are hanging on to the
I feel like this post is entirely inappropriate considering the current state of the market today, where it happens to be rallying in a manner no one foresaw at the close yesterday. Even so, we’ve seen how many reversals this market has experienced the following day, and if tomorrow doesn’t follow through on today’s gains,
A beautiful double top much like what we talked about on 5/3 when we shorted it then. I am looking for a strong leg down here. Essentially, you a bear flag that can't push through the 50-day or 20-day moving averages. Confirmation on SPX head and shoulders pattern should speed up the downside of this
To describe this market, there is no chart, and no analysis that can do it better than this random Russian guy deciding to go down a metal slide. The results speak for themselves and for the state of the current market: Needless to say, even though the bears have owned this market (sort of) over
Bears so far has put in a lackluster effort of driving this market lower, but despite yesterday’s rally, still has the favor of all the daily charts on all the indices. If the afternoon can treat them kind and wipe out the gains from yesterday, and perhaps break the lows from last week, then there
It is the best rally that the market has seen in over a month. But there is plenty to be concerned with here still. For one, SPX doesn’t seem to crazy about wanting to push through the 20-day moving average, but it hasn’t been rejected by it yet either. If a hard rejection happens this
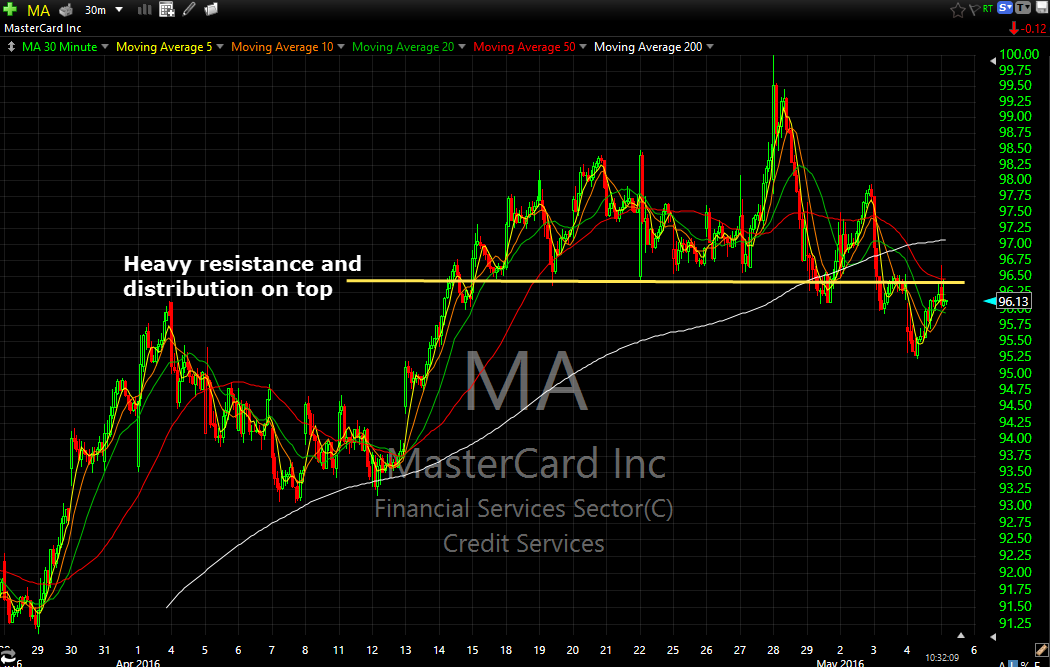
Heavy amounts of distribution for the better part of April and into May with the 20-day moving average providing substantial resistance overhead as well as an ugly weekly chart that seems to be hitting resistance again on the long-term time frame and on the 30 minute chart it shows more clearly the heavy distribution and
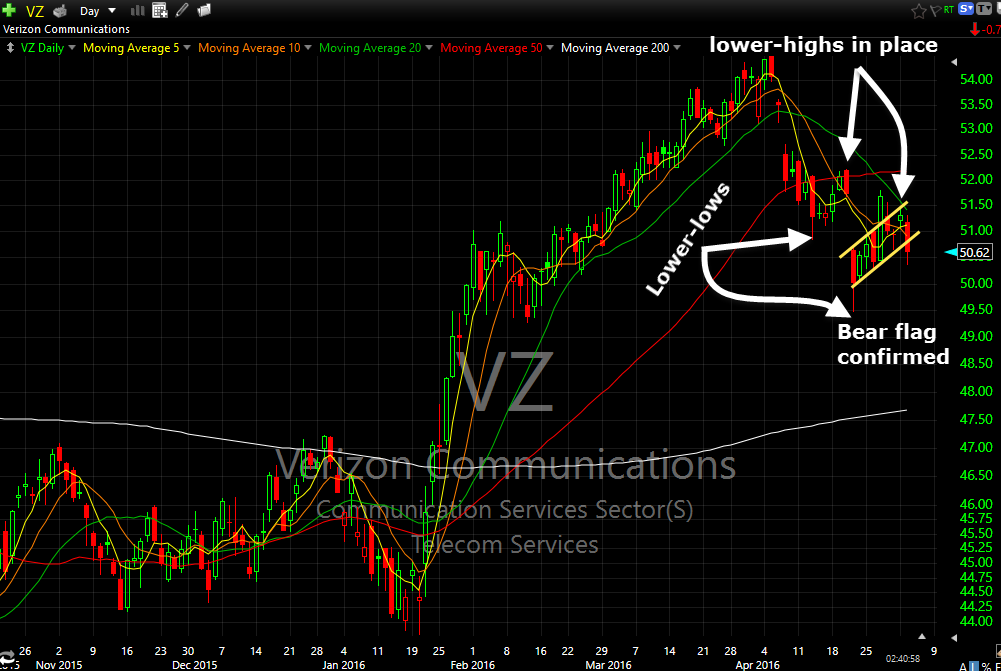
Bear flag on VZ that is confirming to the downside along with a nice series of lower-highs and lower-lows. 30 minute chart also suggests some resistance at the $51 area. On the weekly chart there is a massive double top pattern brewing.


