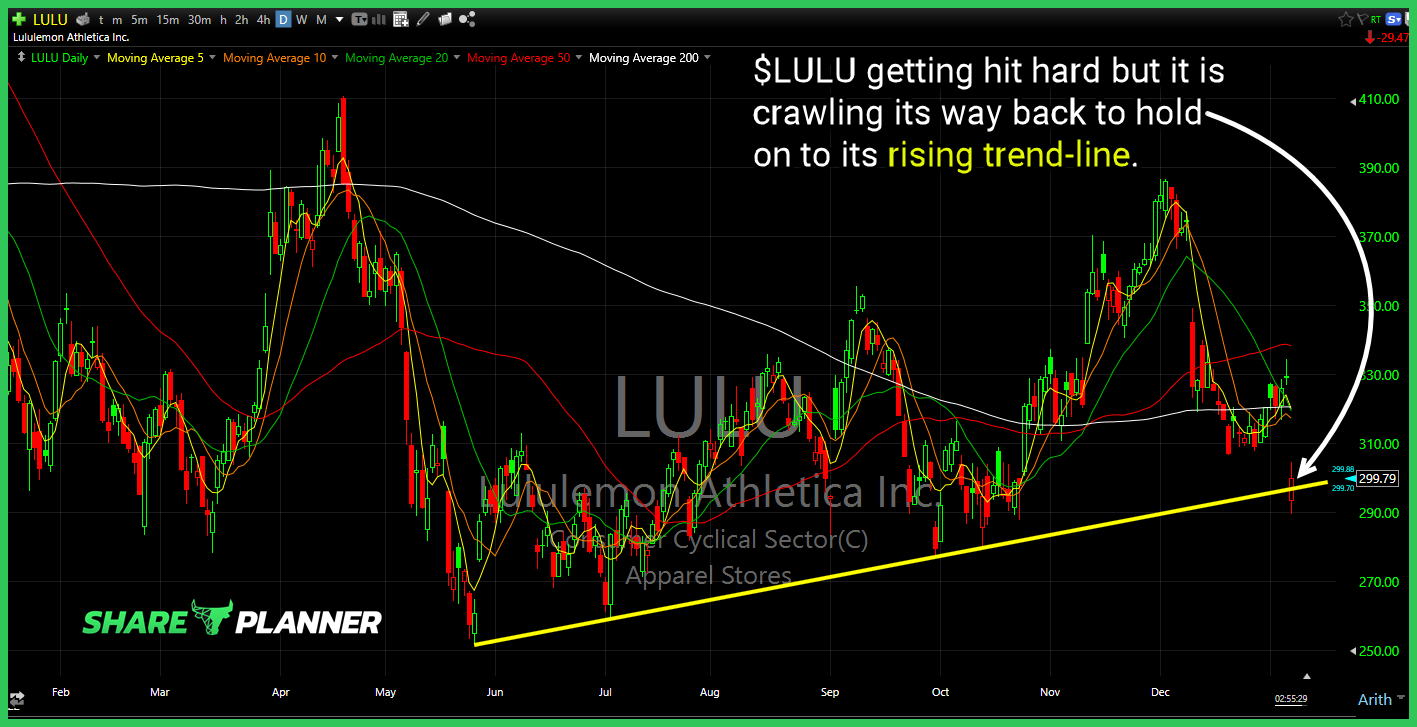
$LULU getting hit hard but it is crawling its way back to hold on to its rising trend-line.
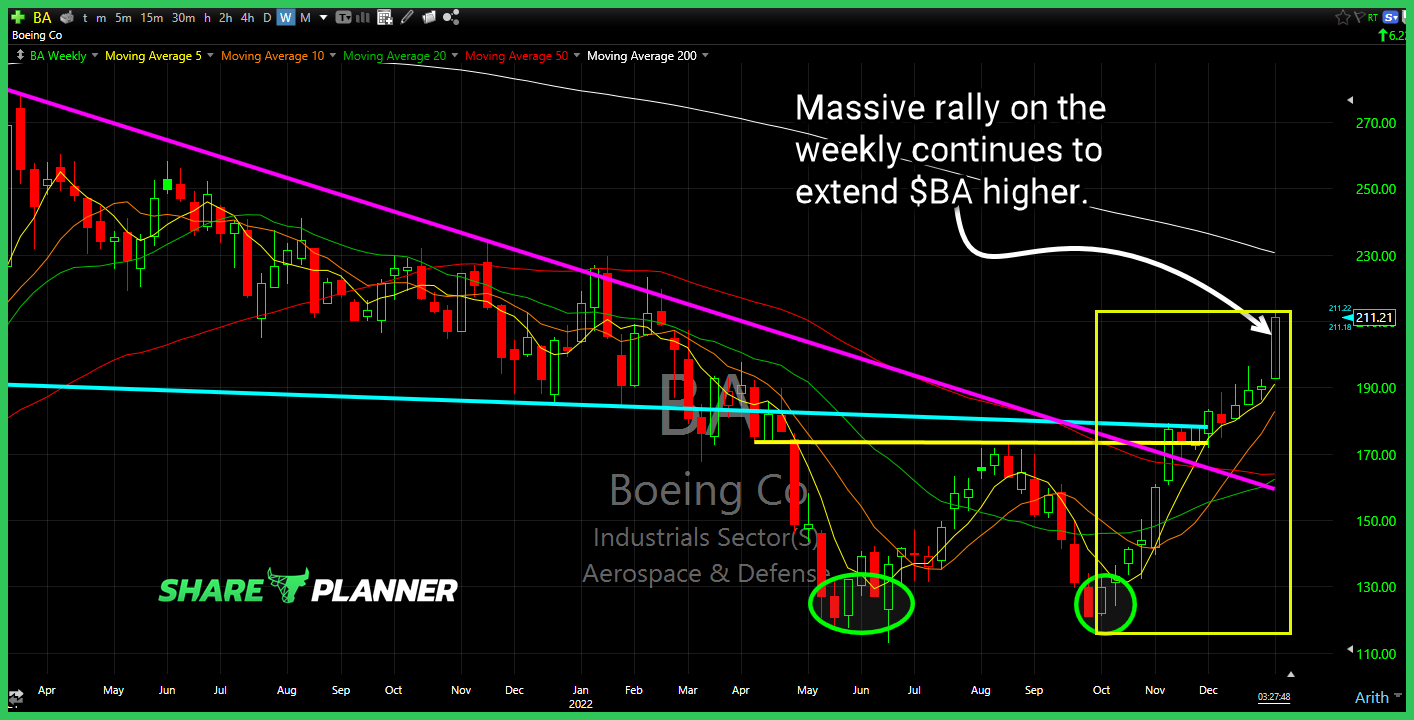
Massive rally on the weekly continues to extend $BA higher.
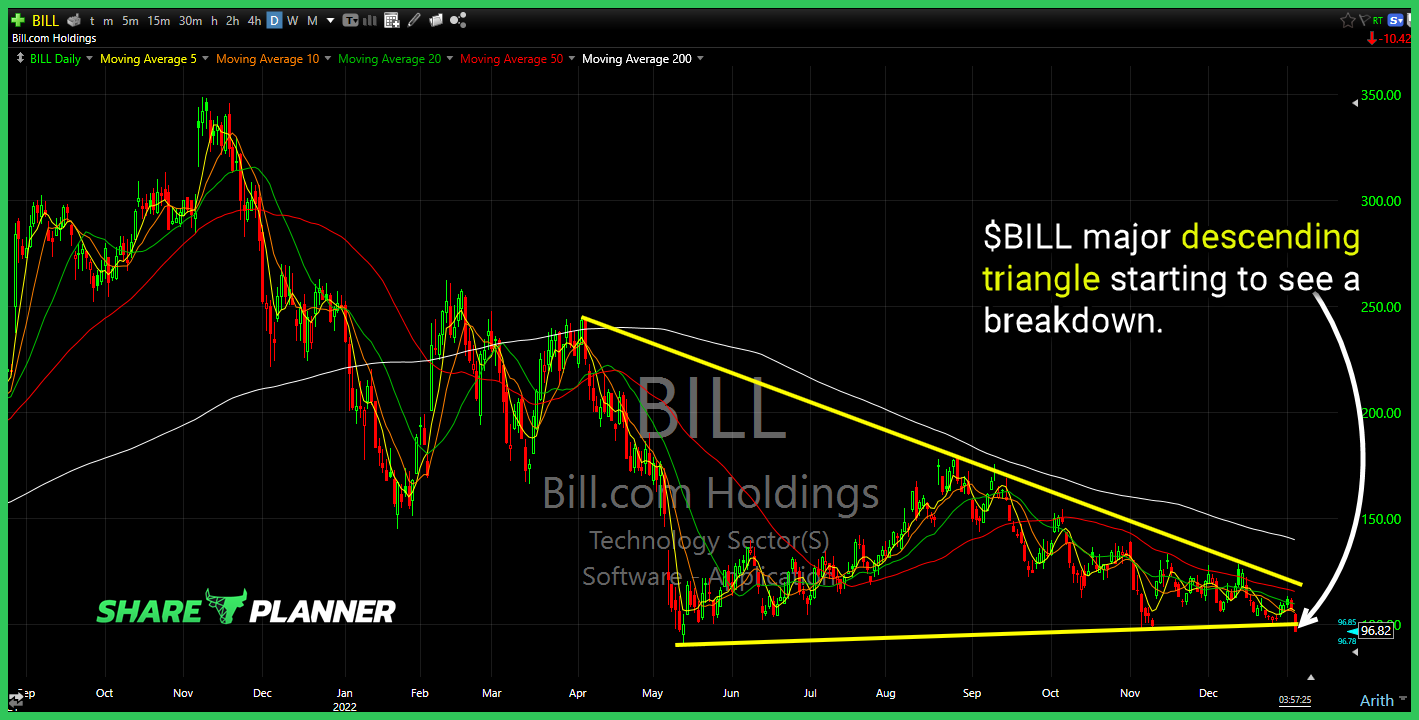
$BILL major descending triangle starting to see a breakdown.
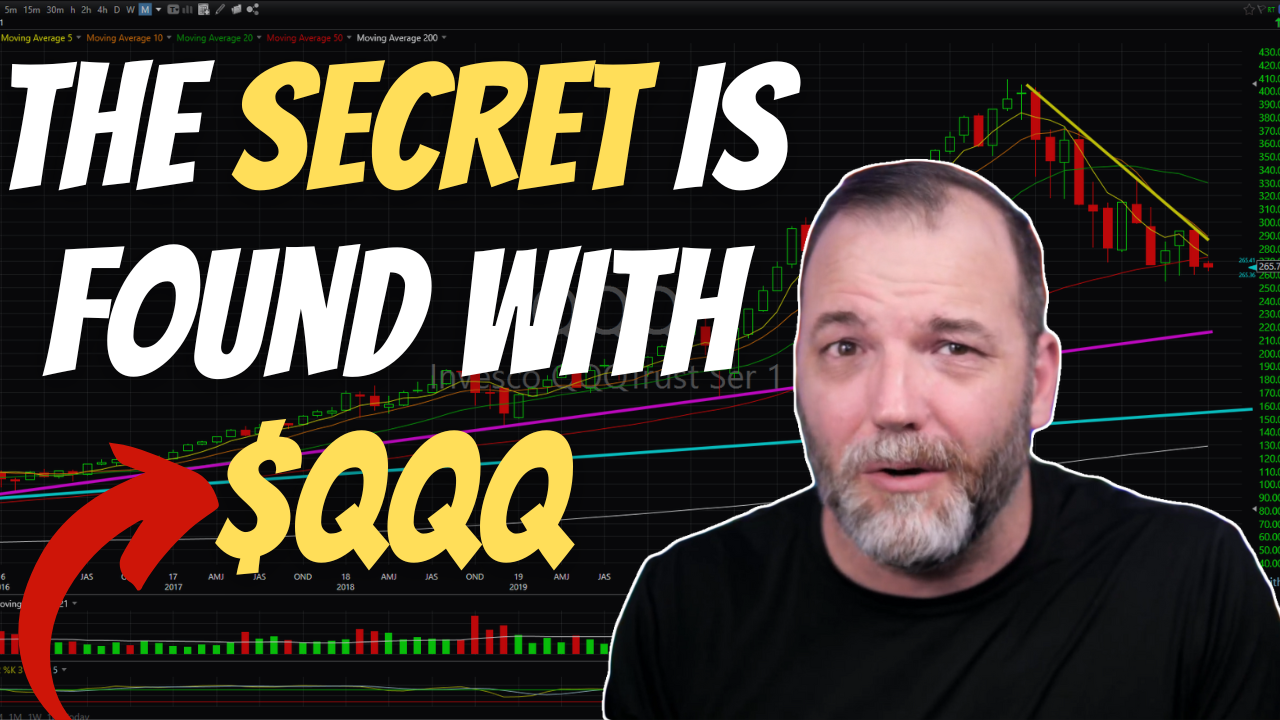
With 2023 underway, when can we expect a stock market bottom? I have found that some clues may lie with the long-term charts of QQQ using technical analysis. Though certainly not a sure thing, past history suggest that the Nasdaq 100 (QQQ) could find its bottom at this key price level.
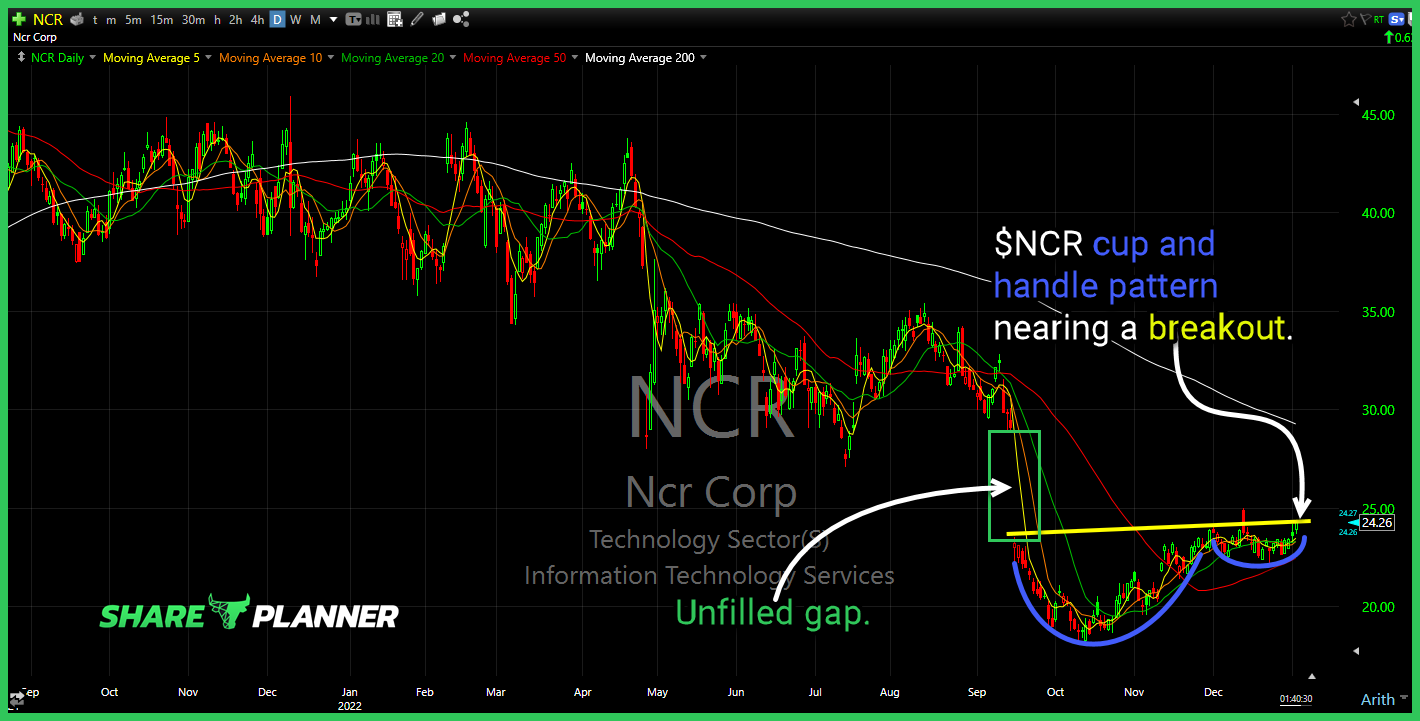
$NCR cup and handle pattern nearing a breakout.
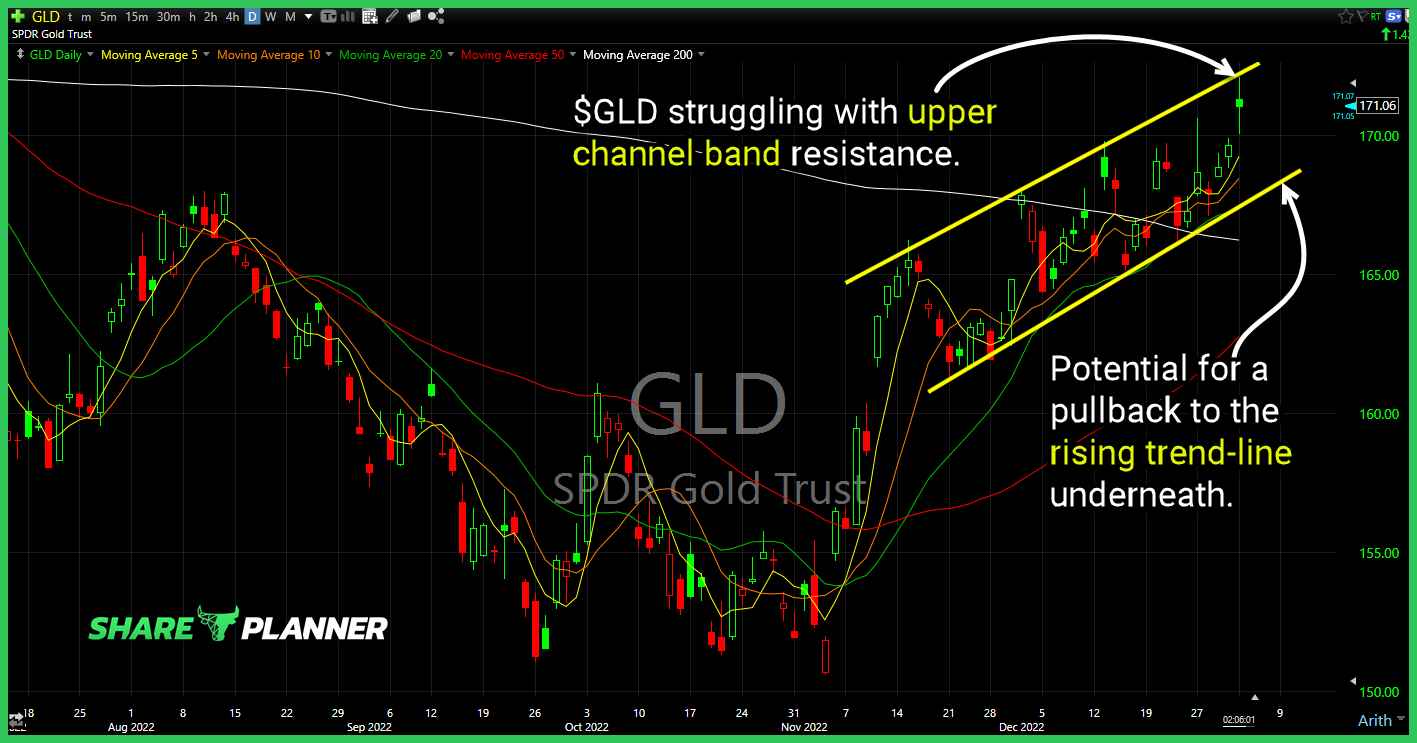
$GLD struggling with upper channel band resistance. Potential for a pullback to the rising trend-line underneath.
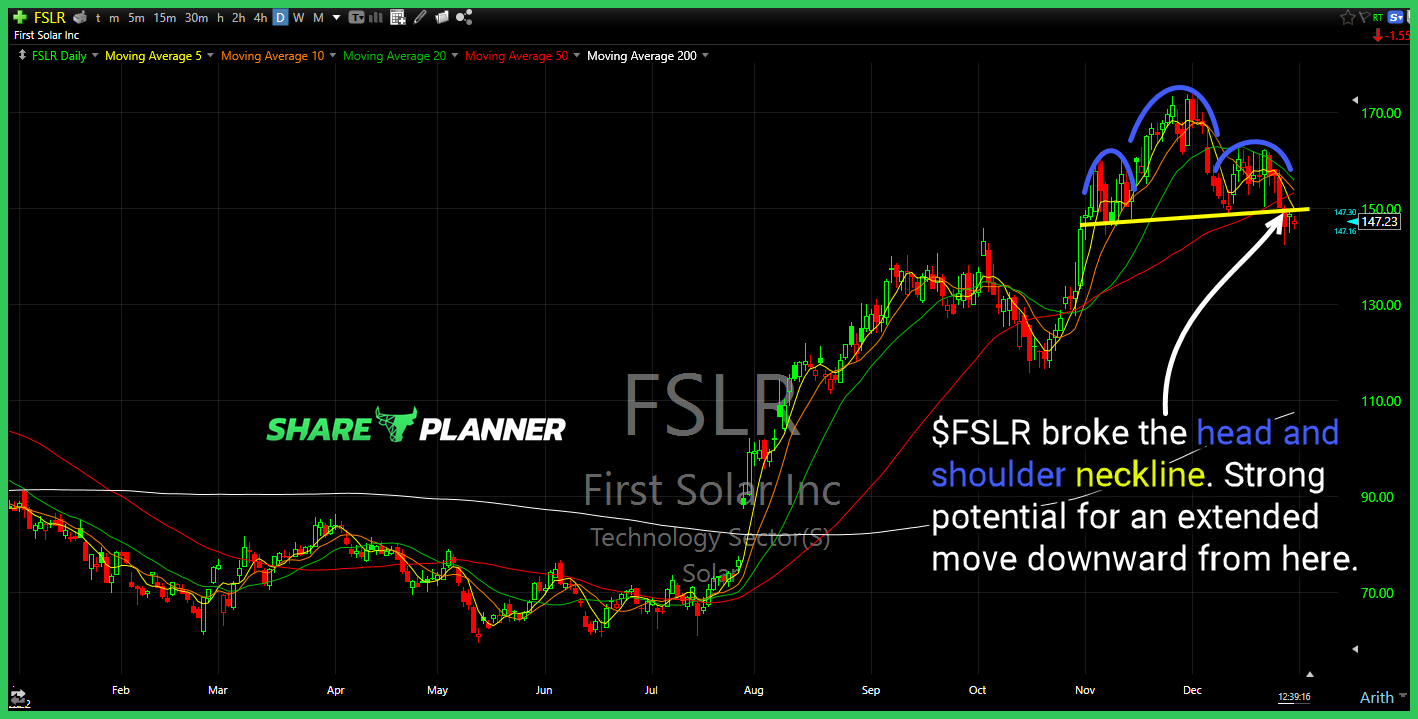
$FSLR broke the head and shoulder neckline. Strong potential for an extended move downward from here.
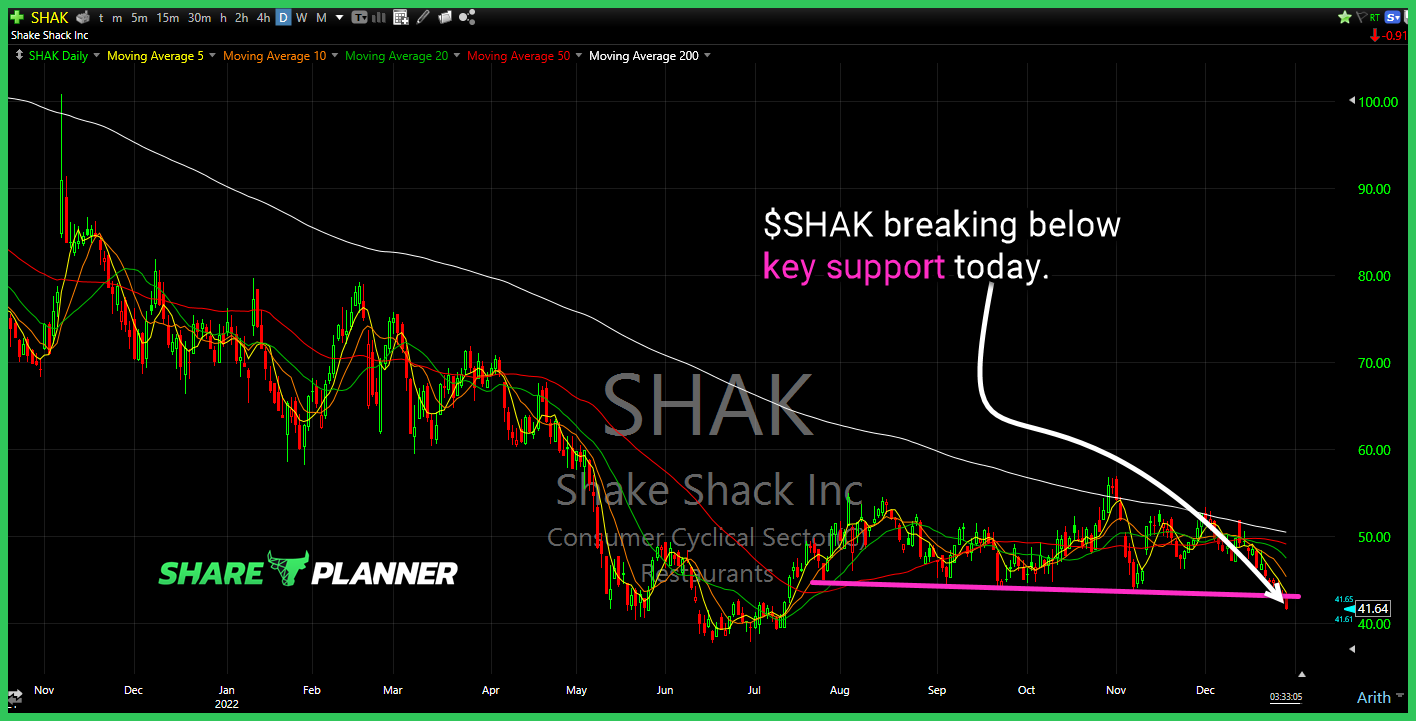
$SHAK breaking below key support today.
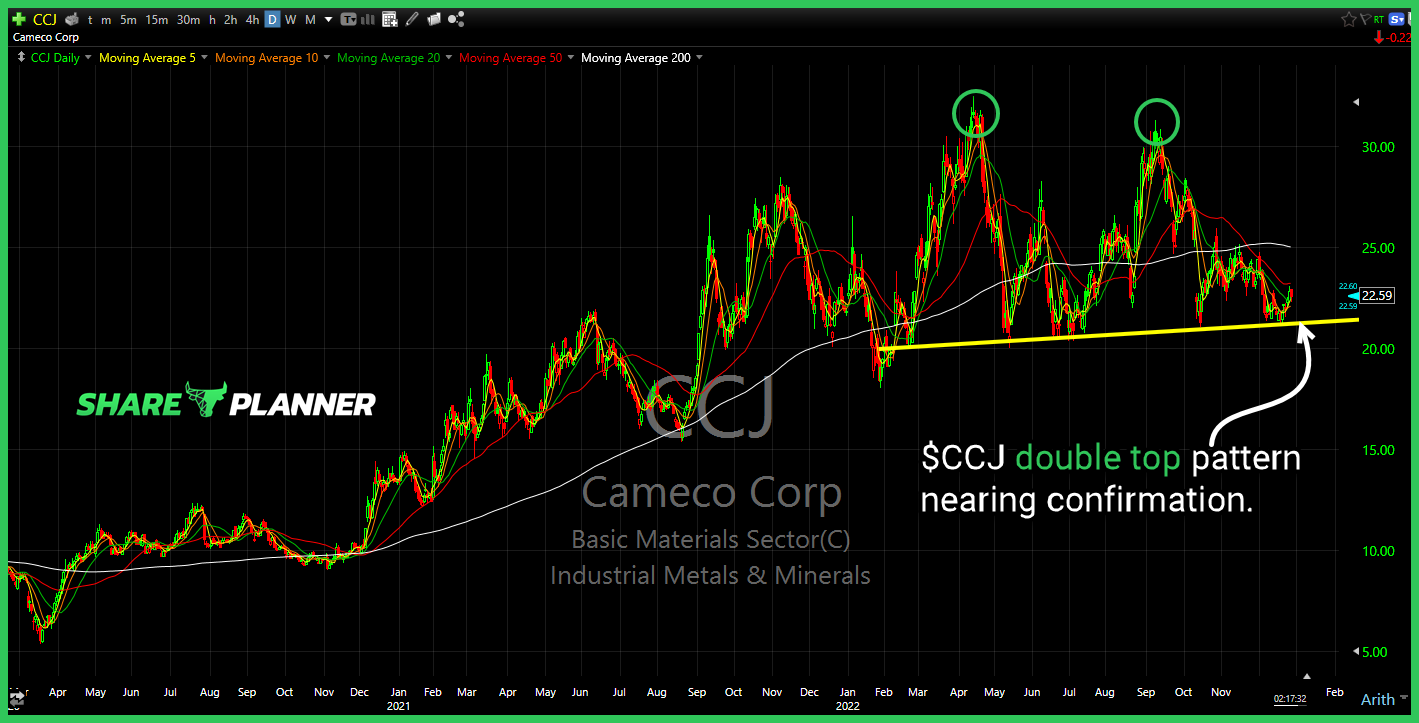
$CCJ double top pattern nearing confirmation.
The Stock Market continues to trend lower with no hope for a Santa Rally in sight for stocks. Is it time to start investing in stocks with the expectation for a Santa Rally or should traders wait until 2023 before considering new stock trades? In this video I provide my analysis for a potential Santa
