My Swing Trading Approach
While the last three days have been solid for the bulls, it is coming on fairly low volume overall. As a result, I may pause here and let the current positions do the work, while making sure that I don’t stack my portfolio with too many more positions, until the market can demonstrate it can break the highs from earlier this month.
Indicators
- Volatility Index (VIX) – I still think that the VIX is headed back towards the 10-11 area as the chart suggests. But a bottom here, would make for a good argument that it could pop over 15-16.
- T2108 (% of stocks trading above their 40-day moving average): Trading higher in four of the last five trading sessions, and now providing a reading of 58%. A move over 60% would be a positive development for the market as a whole.
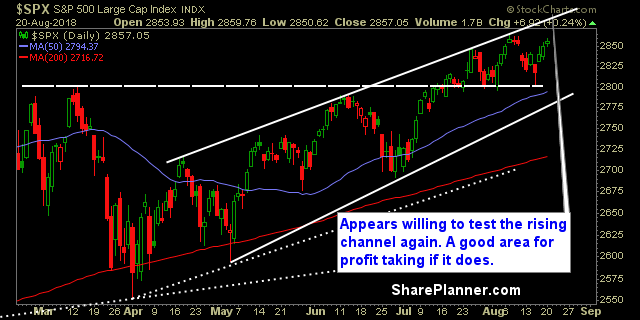
- Moving averages (SPX): Trading above all the major moving averages.
- RELATED: Patterns to Profits: Training Course
Sectors to Watch Today
Discretionary nearing a breakout of the bull flag and led the way yesterday. Needs to break the series of lower-high that is currently on the chart in the short-term. Energy has been bouncing hard over the last three sessions, but I am skeptical of oil until it breaks out of the range. Industrials happens to be one of the best looking sectors right now – made a new higher-high yesterday. Materials has all the makings of a dead cat bounce. Technology overdue for a move, but nothing yet. 
My Market Sentiment
I’m still skeptical of the overall market, and its ability to sustain any meaningful gains, until we see that break over the all-time highs established in January. The market has managed to churn higher since the April lows were established, but it hasn’t been without an incredible amount of choppiness.
S&P 500 Technical Analysis
Current Stock Trading Portfolio Balance
- 4 Long Positions

Welcome to Swing Trading the Stock Market Podcast!
I want you to become a better trader, and you know what? You absolutely can!
Commit these three rules to memory and to your trading:
#1: Manage the RISK ALWAYS!
#2: Keep the Losses Small
#3: Do #1 & #2 and the profits will take care of themselves.
That’s right, successful swing-trading is about managing the risk, and with Swing Trading the Stock Market podcast, I encourage you to email me (ryan@shareplanner.com) your questions, and there’s a good chance I’ll make a future podcast out of your stock market related question.
Emotional trading will destroy one’s portfolio. Aiming to hit home runs with every trade is a sure sign that the trader is overly emotional and only cares about fast money. In this podcast episode Ryan explains how chasing after stocks like MicroStrategy (MSTR) without a plan for managing the risk can ultimately ruin a trader’s attempt at being a successful swing-trader.
Be sure to check out my Swing-Trading offering through SharePlanner that goes hand-in-hand with my podcast, offering all of the research, charts and technical analysis on the stock market and individual stocks, not to mention my personal watch-lists, reviews and regular updates on the most popular stocks, including the all-important big tech stocks. Check it out now at: https://www.shareplanner.com/premium-plans
📈 START SWING-TRADING WITH ME! 📈
Click here to subscribe: https://shareplanner.com/tradingblock
— — — — — — — — —
💻 STOCK MARKET TRAINING COURSES 💻
Click here for all of my training courses: https://www.shareplanner.com/trading-academy
– The A-Z of the Self-Made Trader – https://www.shareplanner.com/the-a-z-of-the-self-made-trader
– The Winning Watch-List — https://www.shareplanner.com/winning-watchlist
– Patterns to Profits — https://www.shareplanner.com/patterns-to-profits
– Get 1-on-1 Coaching — https://www.shareplanner.com/coaching
— — — — — — — — —
❤️ SUBSCRIBE TO MY YOUTUBE CHANNEL 📺
Click here to subscribe: https://www.youtube.com/shareplanner?sub_confirmation=1
🎧 LISTEN TO MY PODCAST 🎵
Click here to listen to my podcast: https://open.spotify.com/show/5Nn7MhTB9HJSyQ0C6bMKXI
— — — — — — — — —
💰 FREE RESOURCES 💰
My Website: https://shareplanner.com
— — — — — — — — —
🛠 TOOLS OF THE TRADE 🛠
Software I use (TC2000): https://bit.ly/2HBdnBm
— — — — — — — — —
📱 FOLLOW SHAREPLANNER ON SOCIAL MEDIA 📱
X: https://x.com/shareplanner
INSTAGRAM: https://instagram.com/shareplanner
FACEBOOK: https://facebook.com/shareplanner
STOCKTWITS: https://stocktwits.com/shareplanner
TikTok: https://tiktok.com/@shareplanner
*Disclaimer: Ryan Mallory is not a financial adviser and this podcast is for entertainment purposes only. Consult your financial adviser before making any decisions.


