My Swing Trading Approach
One additional long position was added to my portfolio yesterday, while taking a 0.7% loss on Eastman Chemicals (EMN). I am open to adding another position today, but I need to see a little more out of my existing positions first.
Indicators
- Volatility Index (VIX) – Broke through the 20-day moving average momentarily, which hasn’t really been done at all, of late. But by the close, all the gains, plus an extra 3% was subtracted from the final tally. Closed at 14.70.
- T2108 (% of stocks trading above their 40-day moving average): A little bit of a rollover here on the T2108, as the indicator shed another 2.3% yesterday, to take it to 80%. There’s no panic seen, just appears to be a natural pullback for the market as it consolidates a two-month rally.
- Moving averages (SPX): Currently trading above all the major moving averages.
- RELATED: Patterns to Profits: Training Course
Sectors to Watch Today
Financials still appears ready to push higher here, and Energy remains in the bull flag pattern. Technology had a significant dip and bounce to finish the day in positive territory. Utilities on a 3-day pullback, but that too, looks like a low volume bull flag to watch.

My Market Sentiment
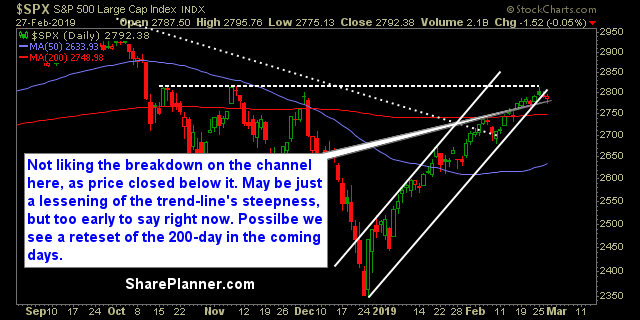
The rising trend-line off of December lows was broken. I don’t think this is cause to sound the alarm. I think more importantly it may just be that the trajectory of the current rally has changed in terms of steepness. Potential for further weakness to result in a re-test of the 200-day moving average.
S&P 500 Technical Analysis
Current Stock Trading Portfolio Balance
- 30% Long.

Welcome to Swing Trading the Stock Market Podcast!
I want you to become a better trader, and you know what? You absolutely can!
Commit these three rules to memory and to your trading:
#1: Manage the RISK ALWAYS!
#2: Keep the Losses Small
#3: Do #1 & #2 and the profits will take care of themselves.
That’s right, successful swing-trading is about managing the risk, and with Swing Trading the Stock Market podcast, I encourage you to email me (ryan@shareplanner.com) your questions, and there’s a good chance I’ll make a future podcast out of your stock market related question. Support this podcast: https://podcasters.spotify.com/pod/show/swingtrading/support
How to trade a stock split: in this podcast episode Ryan talks about the impact of what an announced forward stock split means for a stock that you are considering swing trading, or may already be trading. Also covered are the risks, and the strategy behind stock splits for investors and traders alike.
Be sure to check out my Swing-Trading offering through SharePlanner that goes hand-in-hand with my podcast, offering all of the research, charts and technical analysis on the stock market and individual stocks, not to mention my personal watch-lists, reviews and regular updates on the most popular stocks, including the all-important big tech stocks. Check it out now at: https://www.shareplanner.com/premium-plans
📈 START SWING-TRADING WITH ME! 📈
Click here to subscribe: https://shareplanner.com/tradingblock
— — — — — — — — —
💻 STOCK MARKET TRAINING COURSES 💻
Click here for all of my training courses: https://www.shareplanner.com/trading-academy
– The A-Z of the Self-Made Trader – https://www.shareplanner.com/the-a-z-of-the-self-made-trader
– The Winning Watch-List — https://www.shareplanner.com/winning-watchlist
– Patterns to Profits — https://www.shareplanner.com/patterns-to-profits
– Get 1-on-1 Coaching — https://www.shareplanner.com/coaching
— — — — — — — — —
❤️ SUBSCRIBE TO MY YOUTUBE CHANNEL 📺
Click here to subscribe: https://www.youtube.com/shareplanner?sub_confirmation=1
🎧 LISTEN TO MY PODCAST 🎵
Click here to listen to my podcast: https://open.spotify.com/show/5Nn7MhTB9HJSyQ0C6bMKXI
— — — — — — — — —
💰 FREE RESOURCES 💰
My Website: https://shareplanner.com
— — — — — — — — —
🛠 TOOLS OF THE TRADE 🛠
Software I use (TC2000): https://bit.ly/2HBdnBm
— — — — — — — — —
📱 FOLLOW SHAREPLANNER ON SOCIAL MEDIA 📱
X: https://x.com/shareplanner
INSTAGRAM: https://instagram.com/shareplanner
FACEBOOK: https://facebook.com/shareplanner
STOCKTWITS: https://stocktwits.com/shareplanner
TikTok: https://tiktok.com/@shareplanner
*Disclaimer: Ryan Mallory is not a financial adviser and this podcast is for entertainment purposes only. Consult your financial adviser before making any decisions.
—
Support this podcast: https://podcasters.spotify.com/pod/show/swingtrading/support


