My Swing Trading Strategy
I added one additional long position on the dip yesterday which is off to a good start so far. I’m a little concerned by the extent of yesterday’s pullback and the fact that volume came in to support the selling late yesterday. I’ll hold off on adding any new positions in the early going until we can see that the strength in the pre-market wants to hold.
Indicators
- Volatility Index (VIX) – A 6.7% pop yesterday that challenged the downward trend-line off of the May highs, but wasn’t able to break through it. Could be a fading spot here for the index.
- T2108 (% of stocks trading above their 40-day moving average): Despite a 28 point decline on SPX yesterday, T2108 was only down 4%. The small caps weathered the storm much better than large caps, and kept breadth on NYSE from ever eclipsing 2000.
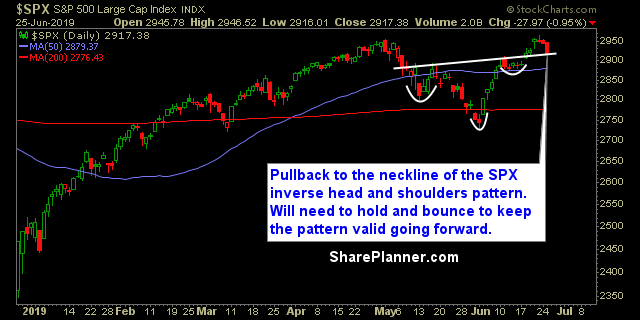
- Moving averages (SPX): Broke right through the 5-day moving average but managed to test and hold the 10-day MA and hold.
- RELATED: Patterns to Profits: Training Course
Sectors to Watch Today
All the sectors finished in the red yesterday with Staples weathering the storm the best. Technology was really the major drag on the market, down nearly 2% and taking on some significant damage on its daily chart. Energy trading back into its gap from last week. Industrials pullback looks slow and steady and without any real panic. 
My Market Sentiment
Inverse head and shoulders pattern still holding up, however price closed right on the neckline yesterday for SPX, and will need to bounce hard today, if the pattern is to remain valid going forward.
S&P 500 Technical Analysis
Current Stock Trading Portfolio Balance
- 30% Long

Welcome to Swing Trading the Stock Market Podcast!
I want you to become a better trader, and you know what? You absolutely can!
Commit these three rules to memory and to your trading:
#1: Manage the RISK ALWAYS!
#2: Keep the Losses Small
#3: Do #1 & #2 and the profits will take care of themselves.
That’s right, successful swing-trading is about managing the risk, and with Swing Trading the Stock Market podcast, I encourage you to email me (ryan@shareplanner.com) your questions, and there’s a good chance I’ll make a future podcast out of your stock market related question. Support this podcast: https://podcasters.spotify.com/pod/show/swingtrading/support
How to trade a stock split: in this podcast episode Ryan talks about the impact of what an announced forward stock split means for a stock that you are considering swing trading, or may already be trading. Also covered are the risks, and the strategy behind stock splits for investors and traders alike.
Be sure to check out my Swing-Trading offering through SharePlanner that goes hand-in-hand with my podcast, offering all of the research, charts and technical analysis on the stock market and individual stocks, not to mention my personal watch-lists, reviews and regular updates on the most popular stocks, including the all-important big tech stocks. Check it out now at: https://www.shareplanner.com/premium-plans
📈 START SWING-TRADING WITH ME! 📈
Click here to subscribe: https://shareplanner.com/tradingblock
— — — — — — — — —
💻 STOCK MARKET TRAINING COURSES 💻
Click here for all of my training courses: https://www.shareplanner.com/trading-academy
– The A-Z of the Self-Made Trader – https://www.shareplanner.com/the-a-z-of-the-self-made-trader
– The Winning Watch-List — https://www.shareplanner.com/winning-watchlist
– Patterns to Profits — https://www.shareplanner.com/patterns-to-profits
– Get 1-on-1 Coaching — https://www.shareplanner.com/coaching
— — — — — — — — —
❤️ SUBSCRIBE TO MY YOUTUBE CHANNEL 📺
Click here to subscribe: https://www.youtube.com/shareplanner?sub_confirmation=1
🎧 LISTEN TO MY PODCAST 🎵
Click here to listen to my podcast: https://open.spotify.com/show/5Nn7MhTB9HJSyQ0C6bMKXI
— — — — — — — — —
💰 FREE RESOURCES 💰
My Website: https://shareplanner.com
— — — — — — — — —
🛠 TOOLS OF THE TRADE 🛠
Software I use (TC2000): https://bit.ly/2HBdnBm
— — — — — — — — —
📱 FOLLOW SHAREPLANNER ON SOCIAL MEDIA 📱
X: https://x.com/shareplanner
INSTAGRAM: https://instagram.com/shareplanner
FACEBOOK: https://facebook.com/shareplanner
STOCKTWITS: https://stocktwits.com/shareplanner
TikTok: https://tiktok.com/@shareplanner
*Disclaimer: Ryan Mallory is not a financial adviser and this podcast is for entertainment purposes only. Consult your financial adviser before making any decisions.
—
Support this podcast: https://podcasters.spotify.com/pod/show/swingtrading/support


