My Swing Trading Strategy
Yesterday was a real clown act by the market. I originally closed out my position in SDS for a 0.6% profit, only to have jump right back in the trade later in the day following the Trump Tweet. Right now, I have one staple play and one short position.
Indicators
- Volatility Index (VIX) – Another massive move to the upside yesterday of 11%,m to 17.87, the highest such reading since June 3rd, when the market bottomed following the May sell-off.
- T2108 (% of stocks trading above their 40-day moving average): A very hard 19% sell-off yesterday, took the indicator down to 46%, and out of the month long consolidation range from July. The lowest closing since June 26th. Today’s gap down in equities, should push the indicator even lower today.
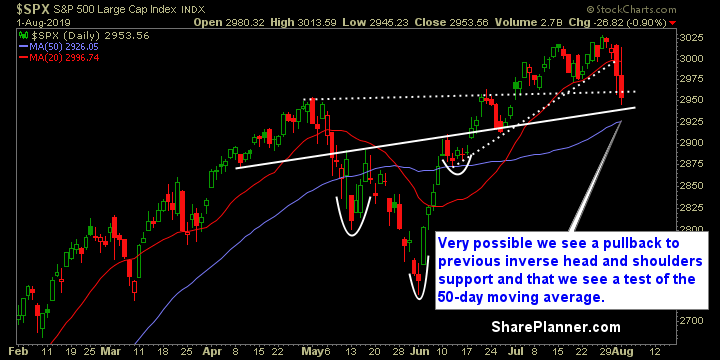
- Moving averages (SPX): Broke above the 5, 10 and 20-day MA’s but eventually dropped hard below all of them for a second straight day. The 50-day moving average will be in play today.
- RELATED: Patterns to Profits: Training Course
Sectors to Watch Today
For a full sector analysis, check out my post here. 
My Market Sentiment
SPX has broken below the previous break out level, and now looks to test the previous inverse head and shoulders neckline. Also the 50-day moving average should be considered in play too.
S&P 500 Technical Analysis
Current Stock Trading Portfolio Balance
- 1 long position, 1 short position.

Welcome to Swing Trading the Stock Market Podcast!
I want you to become a better trader, and you know what? You absolutely can!
Commit these three rules to memory and to your trading:
#1: Manage the RISK ALWAYS!
#2: Keep the Losses Small
#3: Do #1 & #2 and the profits will take care of themselves.
That’s right, successful swing-trading is about managing the risk, and with Swing Trading the Stock Market podcast, I encourage you to email me (ryan@shareplanner.com) your questions, and there’s a good chance I’ll make a future podcast out of your stock market related question.
In this podcast episode, Ryan Mallory gives insight into his trading journey that started at the very young age of 11 years old. Included in the episode was the challenges he faced, and how he ultimately became a full-time trader.
Be sure to check out my Swing-Trading offering through SharePlanner that goes hand-in-hand with my podcast, offering all of the research, charts and technical analysis on the stock market and individual stocks, not to mention my personal watch-lists, reviews and regular updates on the most popular stocks, including the all-important big tech stocks. Check it out now at: https://www.shareplanner.com/premium-plans
📈 START SWING-TRADING WITH ME! 📈
Click here to subscribe: https://shareplanner.com/tradingblock
— — — — — — — — —
💻 STOCK MARKET TRAINING COURSES 💻
Click here for all of my training courses: https://www.shareplanner.com/trading-academy
– The A-Z of the Self-Made Trader – https://www.shareplanner.com/the-a-z-of-the-self-made-trader
– The Winning Watch-List — https://www.shareplanner.com/winning-watchlist
– Patterns to Profits — https://www.shareplanner.com/patterns-to-profits
– Get 1-on-1 Coaching — https://www.shareplanner.com/coaching
— — — — — — — — —
❤️ SUBSCRIBE TO MY YOUTUBE CHANNEL 📺
Click here to subscribe: https://www.youtube.com/shareplanner?sub_confirmation=1
🎧 LISTEN TO MY PODCAST 🎵
Click here to listen to my podcast: https://open.spotify.com/show/5Nn7MhTB9HJSyQ0C6bMKXI
— — — — — — — — —
💰 FREE RESOURCES 💰
My Website: https://shareplanner.com
— — — — — — — — —
🛠 TOOLS OF THE TRADE 🛠
Software I use (TC2000): https://bit.ly/2HBdnBm
— — — — — — — — —
📱 FOLLOW SHAREPLANNER ON SOCIAL MEDIA 📱
X: https://x.com/shareplanner
INSTAGRAM: https://instagram.com/shareplanner
FACEBOOK: https://facebook.com/shareplanner
STOCKTWITS: https://stocktwits.com/shareplanner
TikTok: https://tiktok.com/@shareplanner
*Disclaimer: Ryan Mallory is not a financial adviser and this podcast is for entertainment purposes only. Consult your financial adviser before making any decisions.


