Technical Analysis:
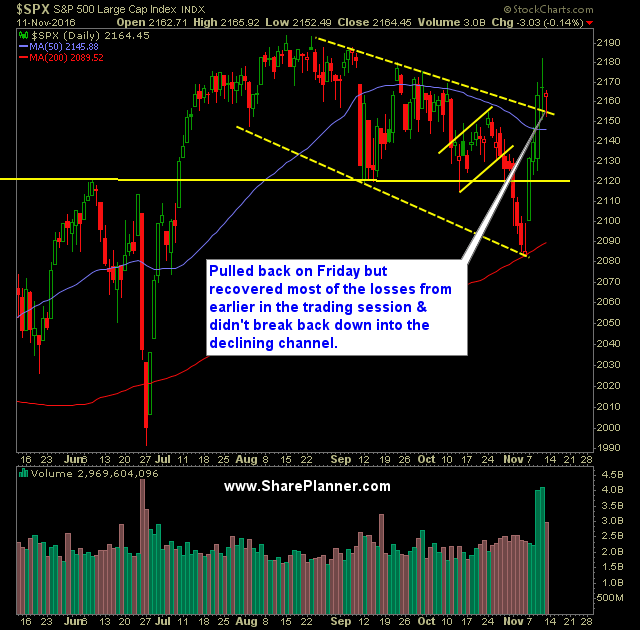
- On the only attempt at a move lower last week by the S&P 500 (SPX), the dip buyers re-emerged and bounced the market off of its 5-day moving average.
- Friday’s slight sell-off ended SPX’s 4-day winning streak.
- Short term, the market is undoubtedly overbought.
- Volume on SPDRs S&P 500 (SPY) saw a massive drop-off compared to the last two days, but still managed to match recent averages.
- The Dow Jones Industrials (DJIA) is in a whole other league of its own, nearly rallying 1,000 points last week, coming mainly from the major rallies in the banks. In doing so, DJIA easily cruised to new all-time highs, breaking the ones previously established in August.
- CBOE Market Volatility Index (VIX) had one of its biggest one weeks sell-offs ever, and is now testing the rising trend-line off of the August lows.
- It is widely expected that the Federal Reserve will be forced to raise interest rates for the first time this year during their meeting in December. But the market has not been concerned with that at this point.
- Crude continues to drop (/CL) but nobody seems to care really, and the oil companies are barely seeing any weakness. However, a break below July’s lows, would catch everyone’s attention.
- Over the past two days, SPX has actually put together some what of a distribution area on the 30 minute chart. A break below 2151, would get the engines going for the bears.
- For the bears, the key area will be the 200-day moving average, which SPX is far from at this juncture.
- There is a clear rotation taking place in this market where money is flowing from tech and utilities and into defense, banks, and infrastructure.
- Poor breadth continues to dominate this market over the last three trading sessions.
My Trades:
- Covered GOOGL on Friday at $769.30 for a 3.8% profit.
- Sold BA on Friday at $146.90 for a 2.5% profit.
- Did not add any additional trades to the portfolio on Friday.
- Will look to add 1-2 new swing-trades to the portfolio today.
- Currently 10% Short / 90% Cash
Chart for SPX:

Welcome to Swing Trading the Stock Market Podcast!
I want you to become a better trader, and you know what? You absolutely can!
Commit these three rules to memory and to your trading:
#1: Manage the RISK ALWAYS!
#2: Keep the Losses Small
#3: Do #1 & #2 and the profits will take care of themselves.
That’s right, successful swing-trading is about managing the risk, and with Swing Trading the Stock Market podcast, I encourage you to email me (ryan@shareplanner.com) your questions, and there’s a good chance I’ll make a future podcast out of your stock market related question.
In this podcast episode Ryan covers the basics of building a swing trading watchlist for beginning traders. Also covered are the key elements that are necessary to ensuring that the watchlist is functional and capable of providing quality results for one’s swing trading.
Be sure to check out my Swing-Trading offering through SharePlanner that goes hand-in-hand with my podcast, offering all of the research, charts and technical analysis on the stock market and individual stocks, not to mention my personal watch-lists, reviews and regular updates on the most popular stocks, including the all-important big tech stocks. Check it out now at: https://www.shareplanner.com/premium-plans
📈 START SWING-TRADING WITH ME! 📈
Click here to subscribe: https://shareplanner.com/tradingblock
— — — — — — — — —
💻 STOCK MARKET TRAINING COURSES 💻
Click here for all of my training courses: https://www.shareplanner.com/trading-academy
– The A-Z of the Self-Made Trader – https://www.shareplanner.com/the-a-z-of-the-self-made-trader
– The Winning Watch-List — https://www.shareplanner.com/winning-watchlist
– Patterns to Profits — https://www.shareplanner.com/patterns-to-profits
– Get 1-on-1 Coaching — https://www.shareplanner.com/coaching
— — — — — — — — —
❤️ SUBSCRIBE TO MY YOUTUBE CHANNEL 📺
Click here to subscribe: https://www.youtube.com/shareplanner?sub_confirmation=1
🎧 LISTEN TO MY PODCAST 🎵
Click here to listen to my podcast: https://open.spotify.com/show/5Nn7MhTB9HJSyQ0C6bMKXI
— — — — — — — — —
💰 FREE RESOURCES 💰
My Website: https://shareplanner.com
— — — — — — — — —
🛠 TOOLS OF THE TRADE 🛠
Software I use (TC2000): https://bit.ly/2HBdnBm
— — — — — — — — —
📱 FOLLOW SHAREPLANNER ON SOCIAL MEDIA 📱
X: https://x.com/shareplanner
INSTAGRAM: https://instagram.com/shareplanner
FACEBOOK: https://facebook.com/shareplanner
STOCKTWITS: https://stocktwits.com/shareplanner
TikTok: https://tiktok.com/@shareplanner
*Disclaimer: Ryan Mallory is not a financial adviser and this podcast is for entertainment purposes only. Consult your financial adviser before making any decisions.


